The board meeting is next week, and my marketing analytics key metrics are all over the place.
What is marketing analytics for the CMO of a fast-growing company? Only the most important, and most insidious, thing that sneaks up on you during board meeting season. You’re knee-deep in hiring, aligning, and “doing marketing,” and probably don’t have a dedicated team just to assemble your board deck.
For instance, you may find yourself scrambling to pull data from many different marketing and analytics services such as Google AdWords/Analytics, Marketo, Salesforce, and others. Then you aggregate it, massage it into something presentable (Google Sheets, Google Charts, and others) and pray the data is in step with the CFO’s and sales. It rarely is. You spend 80% of your time on the tedious assembly process and 20% of the time actually thinking about what your data is trying to tell you. Sound familiar?
Even worse is when a board member asks a business question your metrics can’t answer. Over time, you start to look like you don’t have a good handle on the business. It’s not surprising that the average tenure of a CMO tends to be the shortest among the C-suite. But now, you no longer need to worry about manually compiling metrics. You can now automate marketing analytics, which saves an enormous amount of time. Now, you can focus on the important stuff: developing a winning strategy with the board.
That’s why automation should be imperative among your marketing analytics goals. The best automation for analytics gives you the speed, accuracy, and completeness that comes from combining all your important marketing data that’s typically siloed across multiple channels. In this post, we’ll walk you through how we used the Tray Universal Automation Cloud to automate marketing analytics.
Milestone analysis
We’ll cover just one example report: volume or milestone analysis. We use this to answer basic questions, such as:
- How many leads did we acquire last week?
- What is the value of the pipeline that we created last month?
- What was the lead source of our closed-won deals last quarter?
Time spans of analysis
To build your marketing analytics roadmap, we’d recommend starting with your audience in mind. Consider how granular your audience likes to see data. Our time spans for analysis and audience are as follows:
- Quarterly: for board reporting
- Monthly: for executive team reviews
- Weekly: for marketing team reviews
- Daily: for individuals managing an area of the business, e.g. paid acquisition
Seven steps to automate revenue funnel reporting
1. Define. First, you must define lead status, opportunity stages, and other key milestones of your revenue funnel. Use locked timestamps for when a lead or opportunity passes each revenue funnel milestone. Make sure that the entire business understands these definitions.
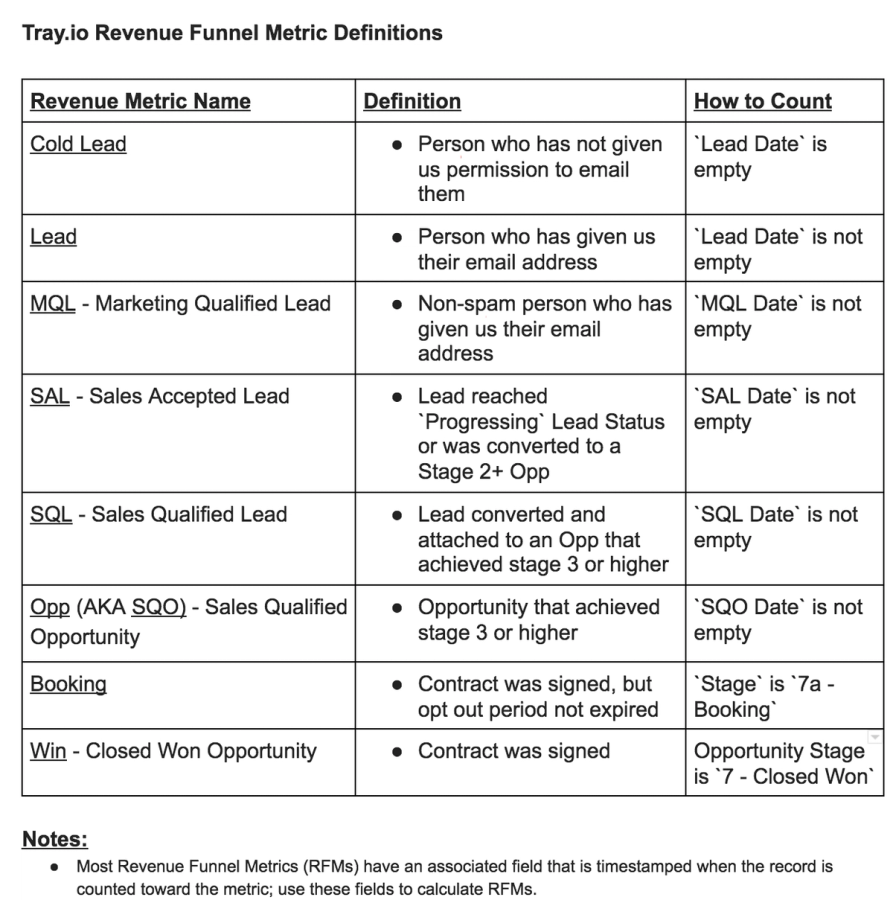
2. Create operational reports. Create operational reporting in each tool. This will give you the ability to validate data from your business intelligence (BI) reports with your source systems. For example, we have a full funnel dashboard with 20 dashlets in Salesforce. Why not use Salesforce dashboards in board reports? For one, it’s hard to add calculations like period-over-period growth rate or stage-to-stage conversion rates. It’s also not easy to add target KPIs into Salesforce dashboards. Finally, Salesforce doesn’t report on the top part of the revenue funnel, like website analytics.
3. Set up a data warehouse. It used to be that only big companies could afford a data warehouse and a team to set up and maintain it, but with the advent of cloud data warehouses like Amazon Redshift, Snowflake, and others, companies of all stripes are adopting this powerful data tool every day.
4. Automate the flow data into your data warehouse. Now, you need to actually pipe data from source systems into your data warehouse. Naturally, we use the Tray platform to connect various marketing tools and stream data into our data warehouse via APIs. We also use a customer data platform, Segment, which makes it easy to pull data from Salesforce, Facebook, and Google AdWords and automatically creates the tables that we need in Redshift. The Tray platform has connectors that Segment does not, so that is why we use both platforms in a complimentary way. With the Tray platform you have the flexibility to pull data in real-time whereas Segment pulls data a couple of times daily.
Tray platform Connectors used:
- Webmaster tools (Google Search Console integration)
- SEO tools (Ahrefs integration, though you can use SEMRush or other tools)
- Social media platforms (LinkedIn integration, Twitter Integration)
- Retargeting (Adroll integration)
- Website analytics (Google Analytics integration)
- CRM (Salesforce integration)
- Data Warehouse (Amazon Redshift integration)
- BI and Data Visualization (Integration with Sisense, formerly known as Periscope Data, though you could use other BI tools such as Microsoft Power BI, Domo, or Looker)
- Forecasting and Modeling (Google Sheets integration)
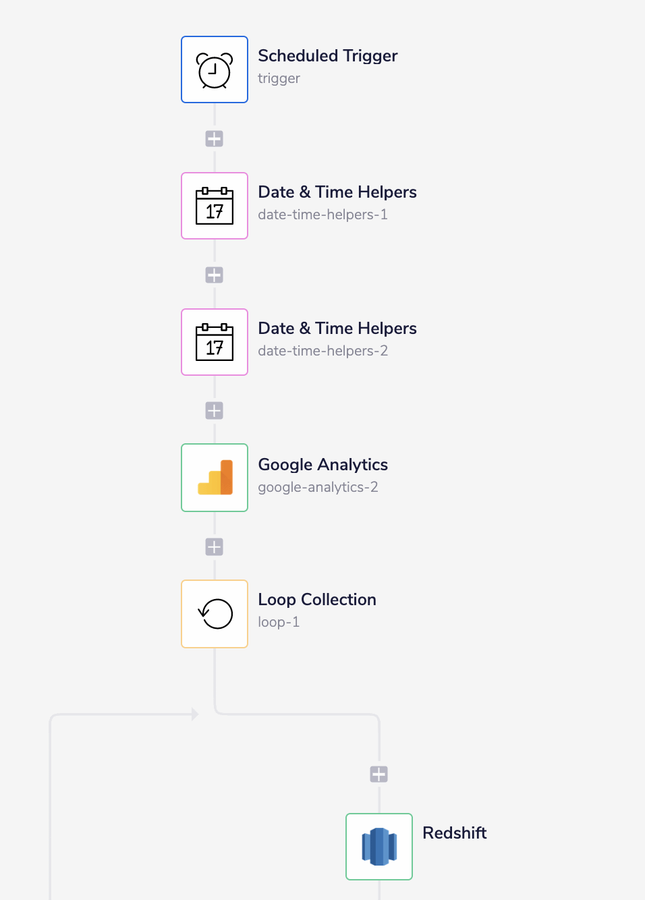
Here’s an example workflow that automates the flow of data from Google Analytics into Redshift:
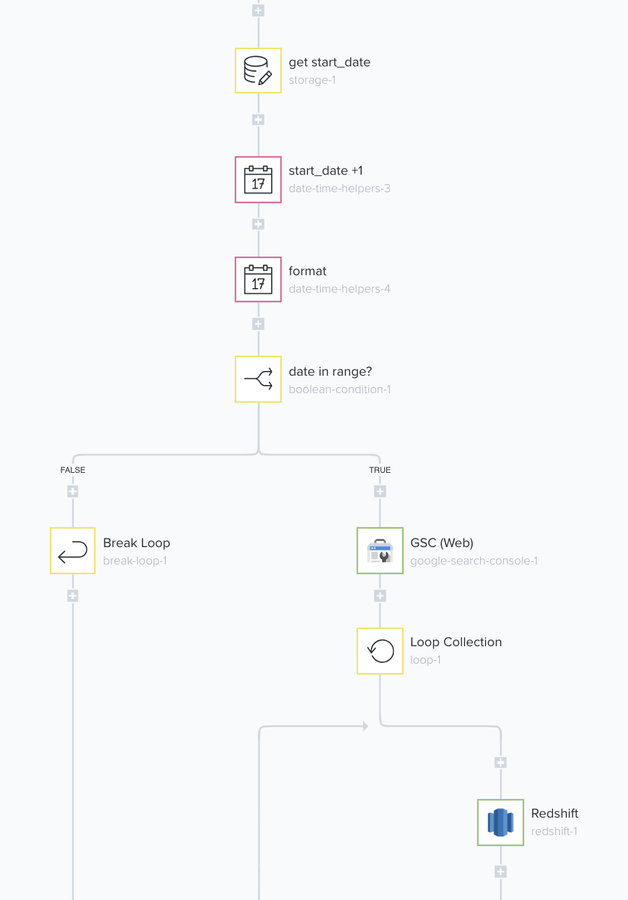
Here is our workflow that automates the flow of data from Google Search Console into Redshift:
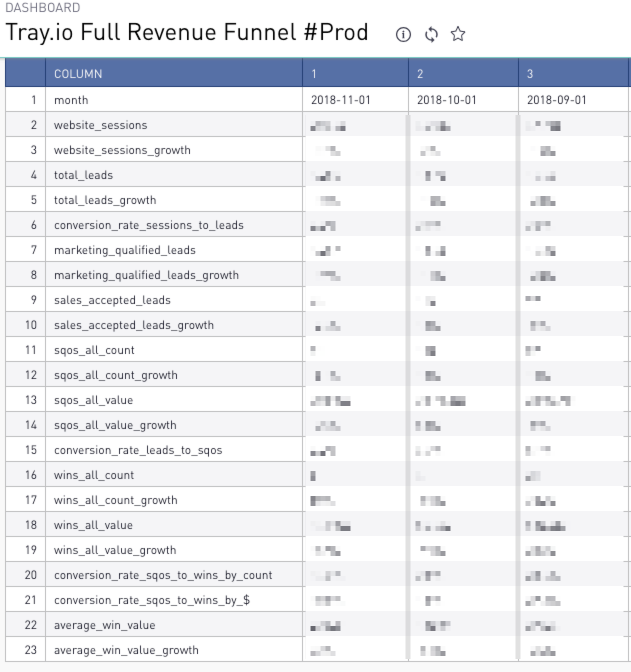
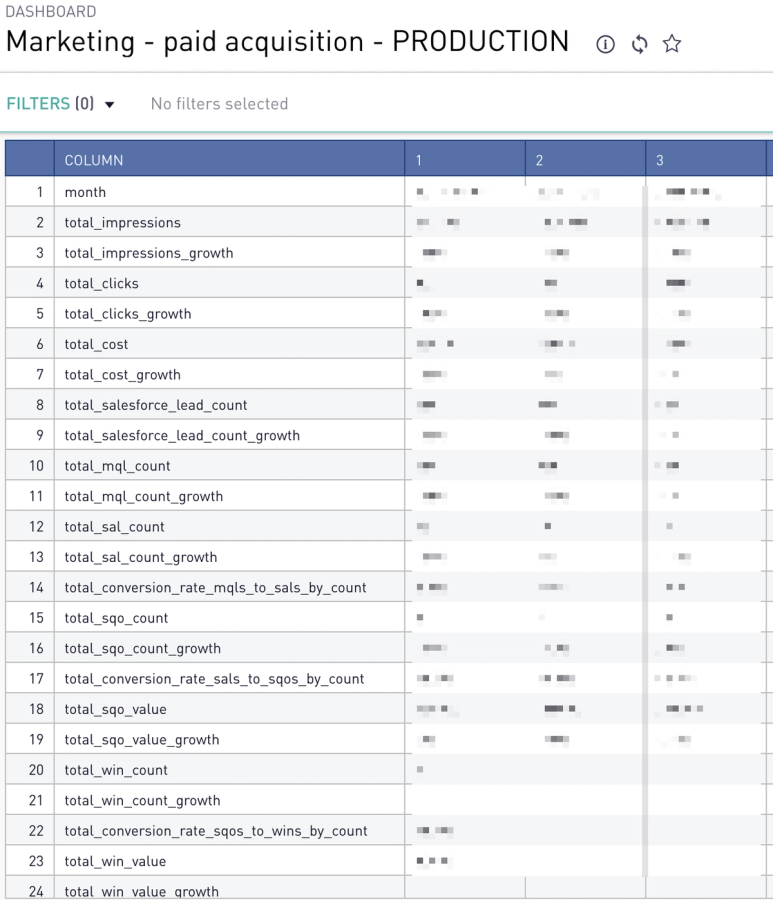
5. Data visualization/business intelligence (BI). Many cloud BI tools sit on top of cloud data warehouses. We happen to use Sisense. You’ll need someone on the team with some SQL skills for this step. Here are a couple of reports out of many that we use to manage the business.
Sisense - Revenue Funnel Dashboard
6. Automate flow of aggregated data into your modelling tool. Now that you have all of the metrics aggregated in one place (Redshift) and accessible (Sisense) It’s time to automate the flow of data to your analysis tool of choice. BI tools are generally not designed to support ad hoc analysis by a business person. We like using Google Sheets so we can easily model scenarios, add targets, and forecast. We use the Tray platform to automate the flow of data from Redshift/Sisense into Google Sheets.
7. Automate flow of data to your presentation tool. It's not always a good idea to share raw spreadsheets to the exec team or board because they don’t tell a story. That’s why we prefer using Google Docs or Google Slides for our board pack so we can share our interpretation alongside the data. Now Google makes it easy to embedded Google Sheets into Docs and Slides. Refreshing is easy with the little “UPDATE” button.
Simply ask with Tray Chat
If you're looking for quick answers to critical business questions, Tray Chat lets anyone (even CMOs) get real-time answers by simply asking in natural language. Remember those milestone analysis questions at the beginning of this blog?
- How many leads did we acquire last week?
- What is the value of the pipeline that we created last month?
- What was the lead source of our closed-won deals last quarter?
CMOs can simply ask Merlin, Tray's AI-powered assistant, and get answers instantly.

Turn conversations into action with Tray Chat.
Recap - Look forward to board meetings with automated marketing analytics
Now that we have this automated, we no longer spend time gathering data. We no longer wring our hands over building a presentable marketing analytics visualization to share with the board. We walk into board meetings better prepared to discuss where we are struggling and where we are excelling. We spend a lot more of our collective brainpower on where we want to take the business and what we’ll need to get there.
If you’d like to see how you too can automate marketing analytics, request a demo of the Tray Universal Automation Cloud.

