
Think back to the early days of API proliferation. Teams were spinning up endpoints, integrating third-party services, and connecting systems with increasing velocity. It was exciting — and completely invisible. Nobody knew which APIs were getting hammered, which were silently failing, who was calling what, or what it was all costing. Then came API management: rate limiting, usage dashboards, consumer analytics, audit trails. Chaos became something you could govern.
We are at exactly that inflection point with MCP, specifically around MCP observability, and most organizations don’t realize it yet.
Most MCP deployments don’t have a black box
MCP has moved from a clever protocol spec to genuine enterprise infrastructure in under a year. AI agents in Claude, Cursor, Copilot, and a growing fleet of custom-built systems, are calling MCP tools constantly: querying databases, triggering workflows, pulling CRM records, writing to Slack. This is real work happening in production systems, on behalf of real users, consuming real compute and real budget.
And for most teams, it is essentially invisible. They’re flying high without a black box.
Ask the average platform team a handful of basic operational questions about their MCP deployment, and watch the confidence drain from the room.
- Which MCP tools are actually being used, and which has nobody called in 30 days?
- Which team or user is responsible for that spike in tool calls last Tuesday?
- Why did this agent workflow fail at 2am, and what was it trying to do?
- How much of this month’s AI spend is attributable to MCP tool execution?
These are not exotic questions. They are the baseline operational hygiene that every engineering leader expects to answer about any system running in production. With MCP, most teams cannot answer them. But to be fair, the tooling to do so simply hasn’t existed.
No engineering team would deploy a REST API with zero logging, zero analytics, and no access audit. Most are doing exactly that with MCP tools every day.
MCP vs. API management: A crash course in maturity
API management didn’t solve all these problems on day one either. But it did eventually produce a rich set of practices and tooling that we now take for granted. MCP needs its API management moment.
Maturity comparison
| API Management (Mature) | MCP Today (Nascent) |
|---|---|
✓Per-consumer usage dashboards, rate limiting, quota enforcement |
○Tool call volumes largely untracked outside server logs |
✓Named authentication — every call is attributable to an identity |
○Executing user identity often unknown to the MCP server |
✓Immutable audit logs for compliance and forensics |
○No standard audit trail — who called what is an open question |
✓Request/response tracing with latency breakdowns |
○Failure diagnosis requires manual log correlation |
✓Cost attribution by team, environment, or endpoint |
○AI cost visibility stops at the LLM layer, not the tool layer |
✓Alerting on error rates, anomalous traffic patterns |
○No normalized alerting or anomaly detection primitives |
MCP observability is closing this gap — but most deployments haven't caught up yet.
This isn’t a criticism of MCP. The protocol is well-designed and the ecosystem is moving fast. Observability infrastructure always lags behind adoption. The problem is that in agentic AI, the consequences of that lag are compressed. When an AI agent starts misbehaving, or a rogue tool call triggers a cascading workflow at scale, you don’t have the luxury of slow forensic investigation.
The pre-flight checklist MCP skipped: Four problems to fix before takeoff
Not all visibility gaps are equal. Based on where enterprises are actually running into walls, four problems rise to the top.
The observability gaps that matter most
Cost attribution
MCP tool executions consume tasks, tokens, and downstream API credits. Without per-tool, per-user cost breakdowns, AI budgets are a black box. You know you spent $X — you have no idea on what, or who drove it.
Adoption blindness
Which tools are high-value and which are dead weight? Without usage analytics, tool libraries sprawl. Teams keep maintaining tools nobody calls while missing the signals that would tell them what agents actually need.
Security & audit
Agentic AI calls tools on behalf of users. Who authenticated? Did the agent act within its permitted scope? In regulated environments, the inability to answer these questions isn't a gap — it's a blocker.
Failure tracing
An agent workflow fails. Was it the LLM reasoning? The tool call itself? A downstream connector? Without step-level execution context, debugging is archaeology — slow, manual, and often inconclusive.
From summary trends to step-level truth
The goal should never be dashboards for their own sake. Rather, you want to be able to move easily between altitudes: from a high-level summary like “MCP tool executions are up 40% this week, and one workflow is driving 60% of that,” all the way down to a specific execution, a specific step, a specific user, with full input/output context when you need it.
That’s the journey API management taught us. You start with trend lines, but the value is in being able to drill without hitting a wall. The MCP version of that is:
- Aggregate execution counts and success rates broken down by tool and by user
- The ability to identify which executing identity triggered each run
- Step-level detail with auth context per step
- A clear line between summary analytics and raw execution logs that you can traverse in seconds
You also need to think about data governance at the log level. Execution data contains sensitive inputs and outputs. Masking by default, with admin-controlled unmask and an audit trail of who accessed what, including admins, is the same pattern mature API management enforces, and it’s the right pattern for MCP too.
Finally, none of this exists in isolation. Log streaming into your SIEM, your observability stack, your cost management tooling — MCP observability data needs to flow where your other operational data already lives. The last thing enterprise teams need is yet another pane of glass that doesn’t talk to anything.
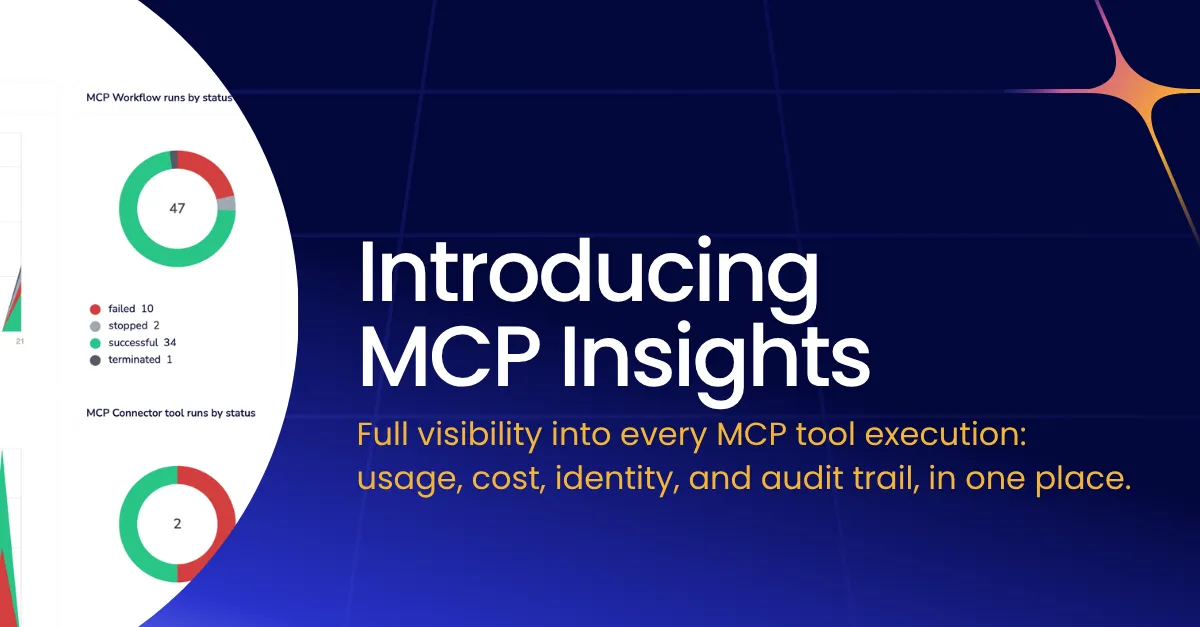
MCP observability in Tray Agent Gateway
Tray Agent Gateway now ships with a full observability layer for MCP, designed around the four problems that matter: adoption visibility, cost attribution, security audit, and failure tracing.
A live dashboard across every MCP tool execution
The Monitor tab gives you a live insights dashboard across all MCP tool executions for any time window: 24 hours, 7 days, or 30 days. Three headline numbers at the top: total tool executions, distinct active Workflow Tool users, distinct active Connector Tool users. Below that, execution volume over time broken down by status — successful, failed, stopped, terminated — with a donut summary so the shape of your traffic is immediately readable.
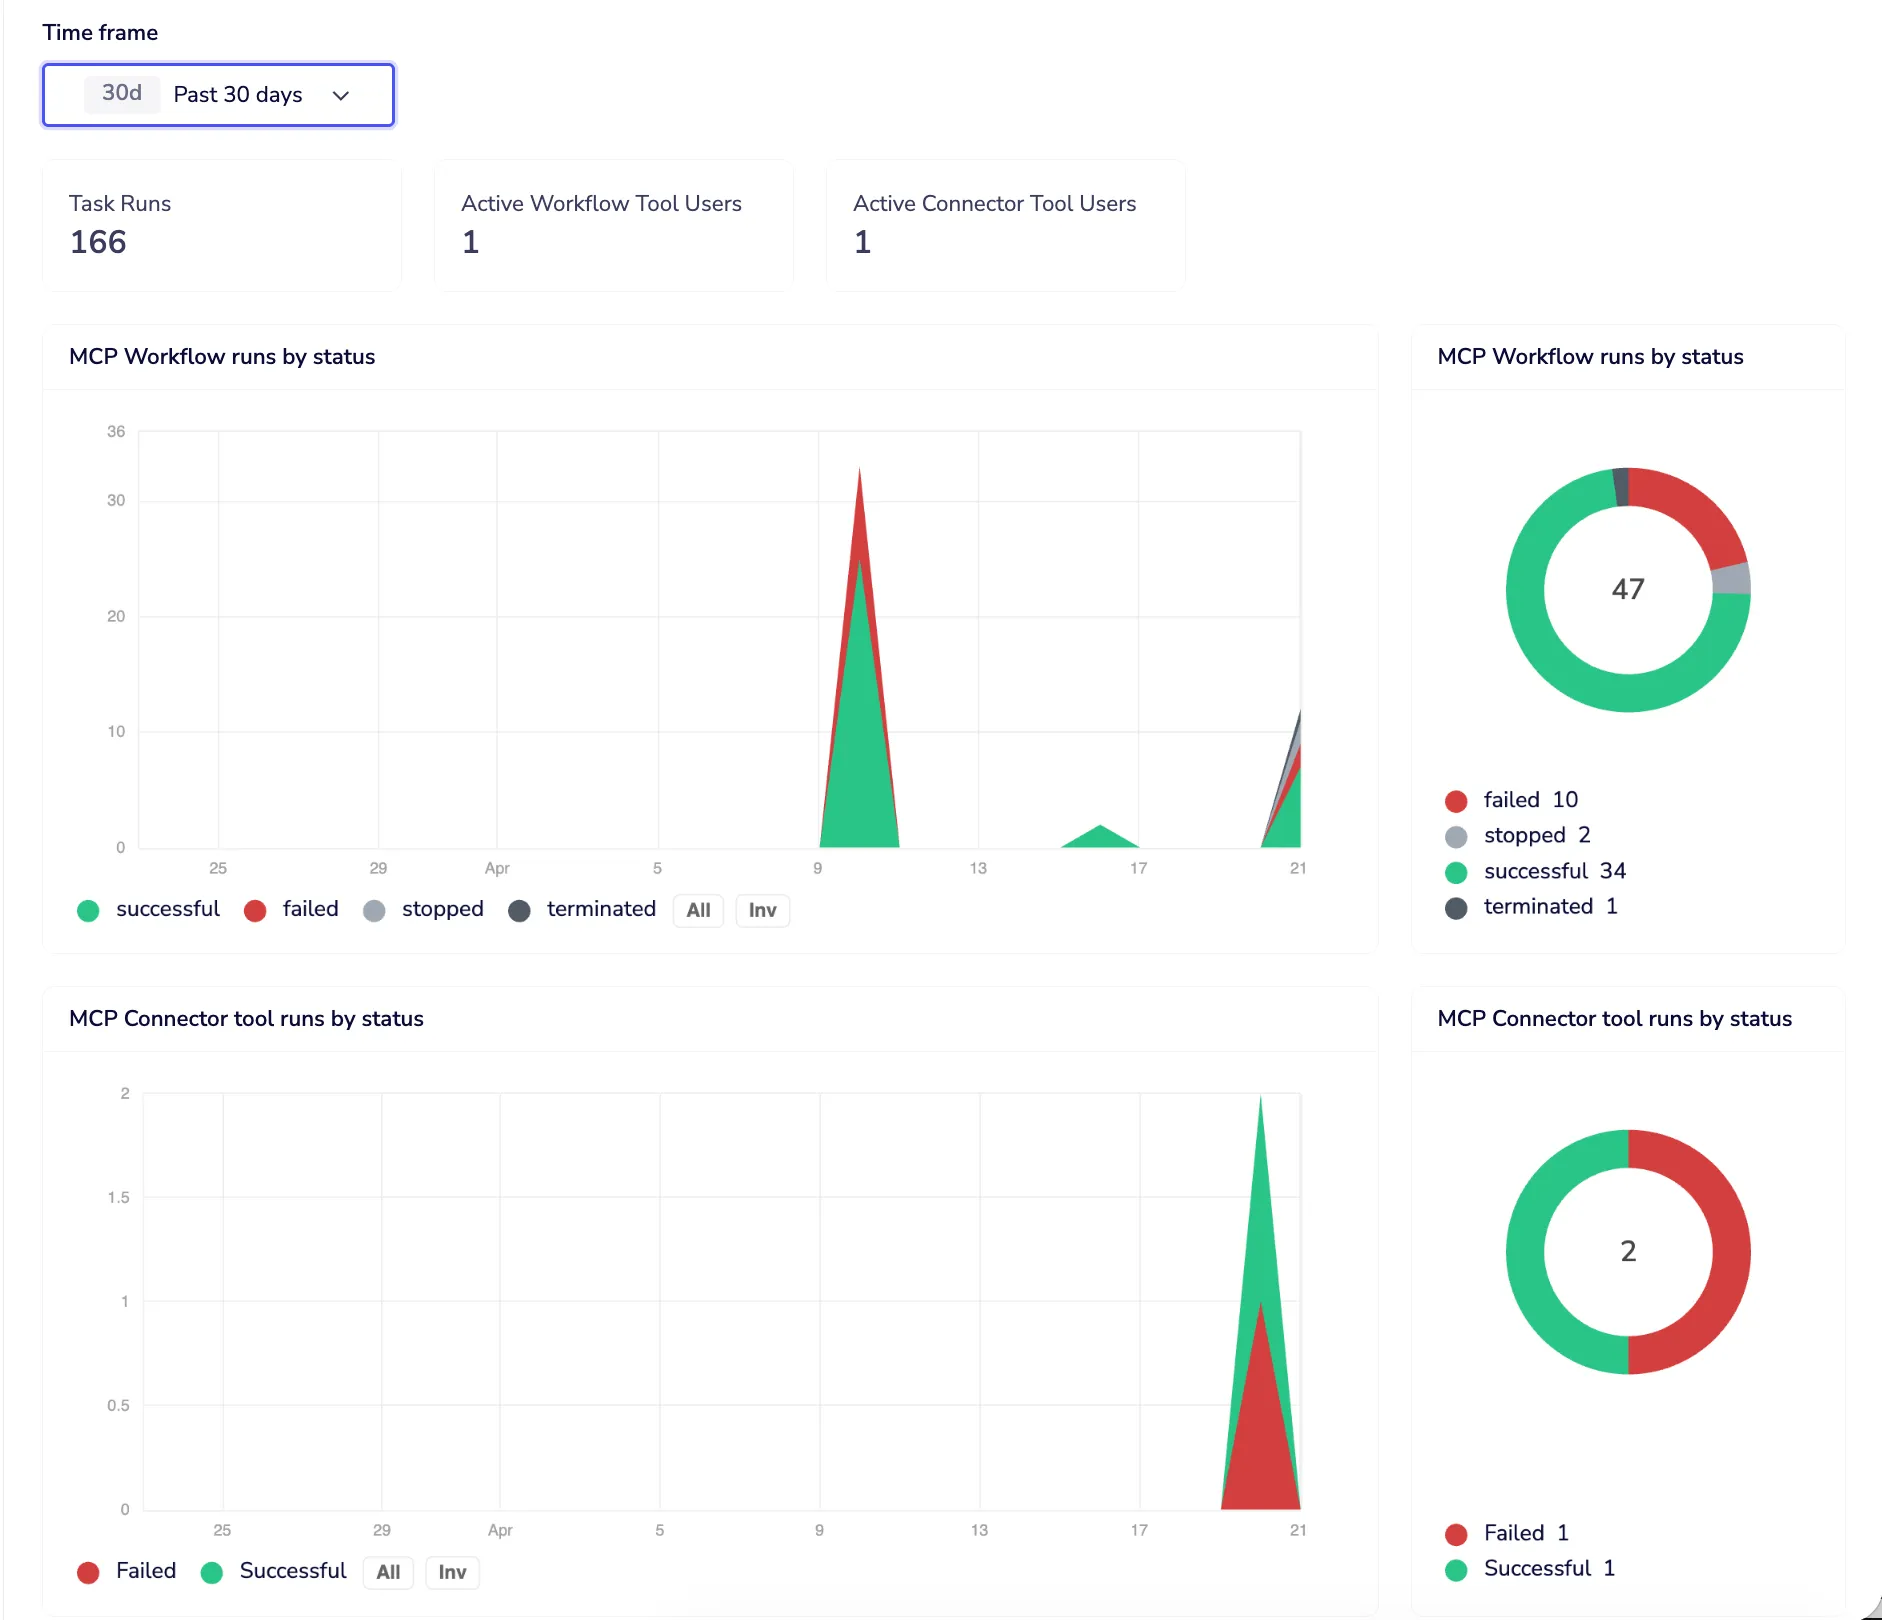
Drill from trend to tool to user in two clicks
Drill into any point on the chart and you get a ranked list of which workflows or connector tools drove that volume, with run counts and success rates, and a direct link to navigate to each one. The same breakdown is available by user, so you can answer “who is responsible for this spike” in two clicks, not two hours.
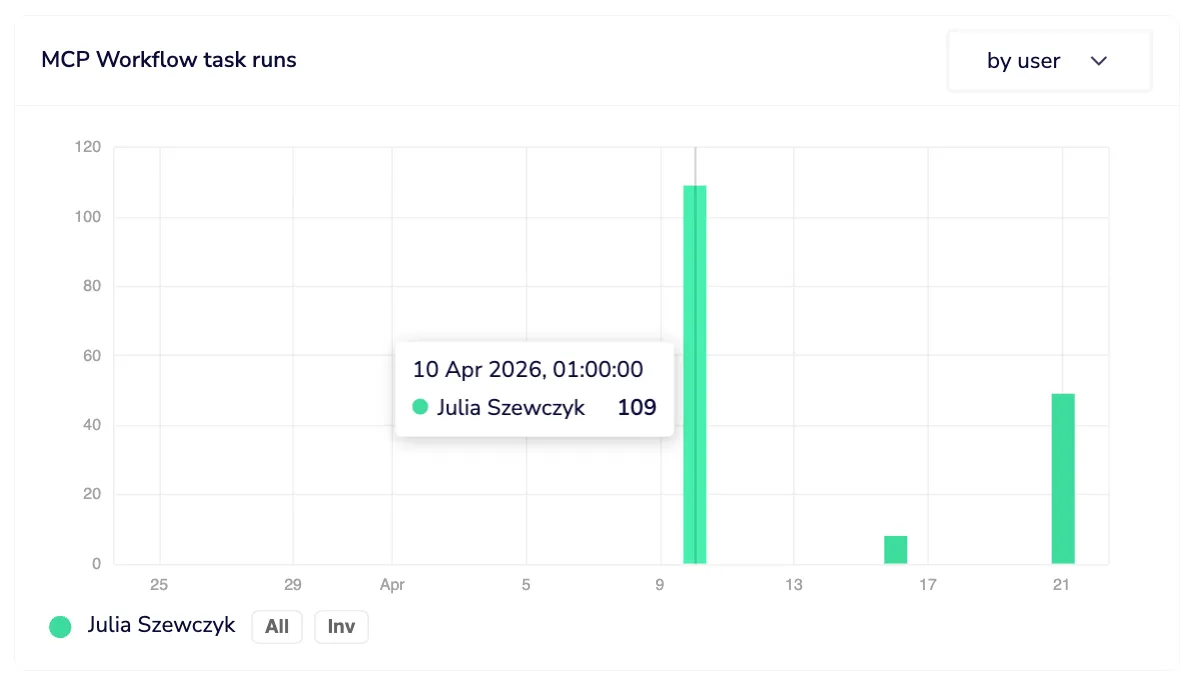
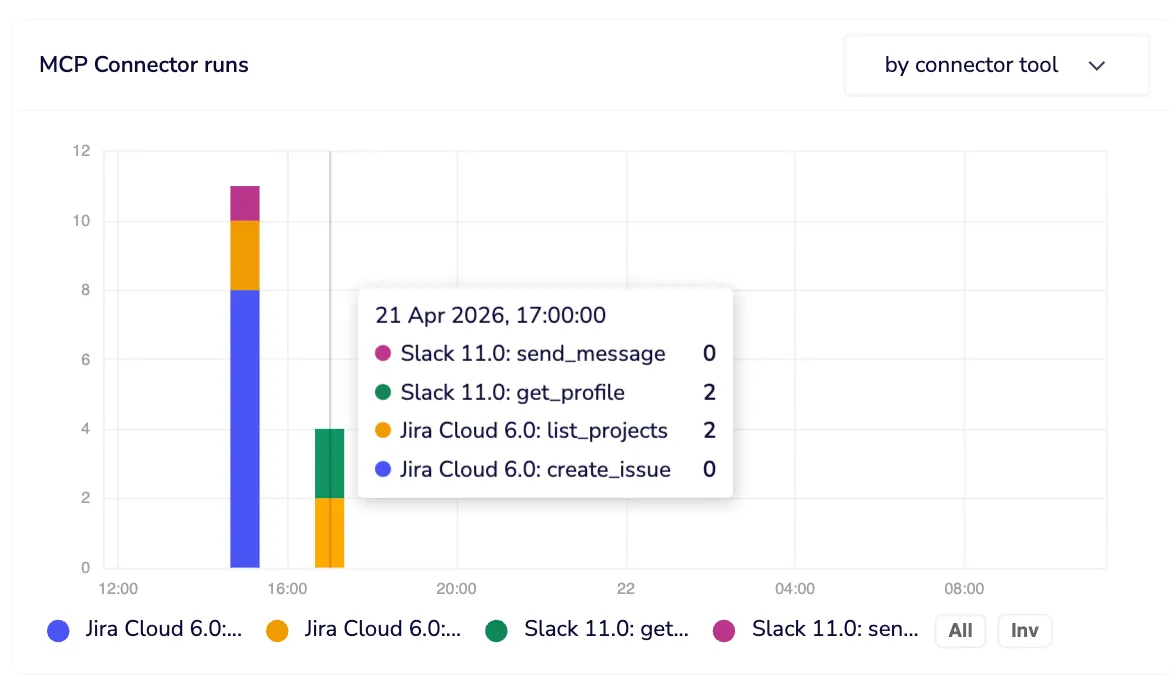
Cost attribution by tool and by user
Task consumption graphs break down which workflow tools and connector tools are consuming the most budget. Each connector tool execution is a single task. Workflow tools can span multiple steps and callables, so you get per-tool and per-user task attribution, giving you the cost visibility that stops “where is our AI spend going?” from being an unanswerable question.
Execution logs with identity at every step
Execution logs take you from that summary view all the way to step-level truth. Every execution triggered via MCP is marked with a purple indicator, so MCP-context runs are immediately distinguishable from other invocations of the same workflow. The executing user’s identity is stamped on every MCP run, made possible by Dynamic Authentication for MCP, which ensures every action runs under the triggering user’s own credentials and permissions. Individual steps that used per-user authentication are flagged inline, with hover tooltips confirming the auth context, so you know not just that a tool ran, but who it ran as.
Sensitive data masked by default
Data masking is on by default. Workspace members see their own execution data in full; other users’ input and output is masked. Admins can unmask, but every unmask is itself logged as an audit event. Access to sensitive data is possible, but it leaves a trace. In regulated environments, that distinction matters enormously.
Log streaming into your existing stack
Log streaming means none of this stays siloed. All execution log data — MCP indicators, user identity, auth context per step — streams into your existing observability and SIEM infrastructure. Your MCP visibility lives where the rest of your operational data lives.
Governance before the audit, not after
Most organizations didn’t implement API management proactively. They did it after a breach, after an unexpected bill, after a compliance audit found gaps that were embarrassing to explain. The window to get ahead of MCP observability is open right now. MCP is still early enough that implementing proper instrumentation isn’t retrofitting, it’s just building correctly from the start.
The teams that treat MCP tool infrastructure with the same operational rigor they’d apply to any production API — identity on every call, cost visibility per tool and per user, audit trails that survive scrutiny, failure traces you can actually use — are the teams that will scale their agent deployments confidently. Everyone else will scale into chaos and spend significant engineering time climbing back out.
Go deeper
Getting MCP Right: Five Properties Every Enterprise Deployment Needs
Observability is one of the five properties that separate enterprise-grade MCP deployments from fragile ones. This guide covers all five — authentication, authorization, discovery, control, and observability — with a practical checklist for each.
Read the guide →