Despite a growing number of data sources, accessible marketing metrics remain in short supply: 87% of marketers today consider data their organization’s most underutilized asset. So how can marketers use metrics to actually make an impact on campaign performance?
This post outlines a process that generates automated alerts to surface key marketing metrics like web traffic, click-through rate, conversion rate, and performance by channel, all in one place. Depending on your directive, these metrics can offer insight into campaign performance, guide strategic decision-making, and align project work to OKRs.
For this workflow, we’ll rely on our low-code automation platform to harness the power of APIs to directly connect different apps. Automation platforms employ API-level automation to trigger certain actions and flow data between sources.
While this specific workflow generates alerts for key social media metrics, it can be easily revised to include additional digital marketing metrics such as organic website traffic acquired via SEO, traffic from paid search, or a number of other metrics. (It’s also possible to up-level this type of dashboard to give higher-level, aggregate metrics such as total traffic, total conversions, and overall pipeline influence.)
Walkthrough: How to automate your marketing metrics
For this walkthrough, we’ve broken up our workflow into four simple steps:
- Initiating our workflow and calculating date ranges - Our workflow initiates with a scheduled trigger, ensuring that we receive alerts on a regular basis. In this step, we also begin to lay the foundation for our alert by recording the date ranges for our period of measurement.
- Pulling metrics from the previous period in Salesforce - With the date ranges recorded in step 1, our second step calls on Salesforce to surface all leads sourced from prespecified channels from the previous period. This provides context for our current data.
- Pulling metrics from the current period in Salesforce - Our workflow again calls on Salesforce to surface all leads sourced from the same channels, but for our current period.
- Calculating relative totals and sending Slack message - Finally, our workflow leverages the data from steps 2 and 3 to calculate comparative statistics and generate a comprehensive snapshot of channel performance.
Step 1: Initiating our workflow and calculating date ranges
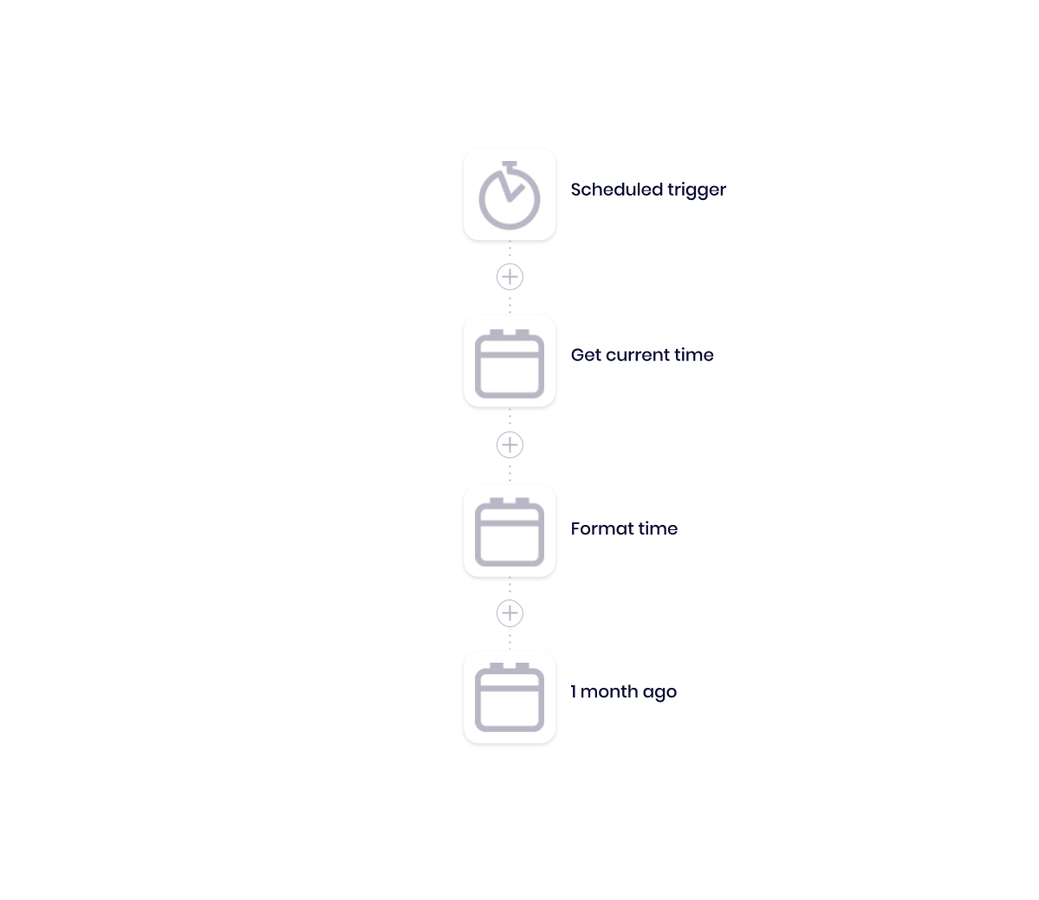
Pictured: Scheduled trigger and calculating date ranges
Our workflow kicks off through a regularly-scheduled timer. This scheduled trigger lets us set the date and time at which our alerts are sending. Once our workflow initiates, it begins a sequence of helpers that gather the date ranges of the current period and previous period.
Later on, our workflow will use these dates to calculate performance to date as well as to compare against the previous month’s performance.
The connectors we used:
- Scheduled trigger: This trigger kicks off the metrics report process at a regularly-scheduled time, such as one or more times per day at set intervals, once a week, once a month, or whatever custom timeframe you need.
- Calendar Helpers: These Helpers record the following date and time information to create a framework for the report:
- Capture current time at which the workflow runs
- Properly format timestamps for use in the workflow
- Pull in date and time from exactly one month prior
Part 2: Pull in the previous period’s channel leads from Salesforce
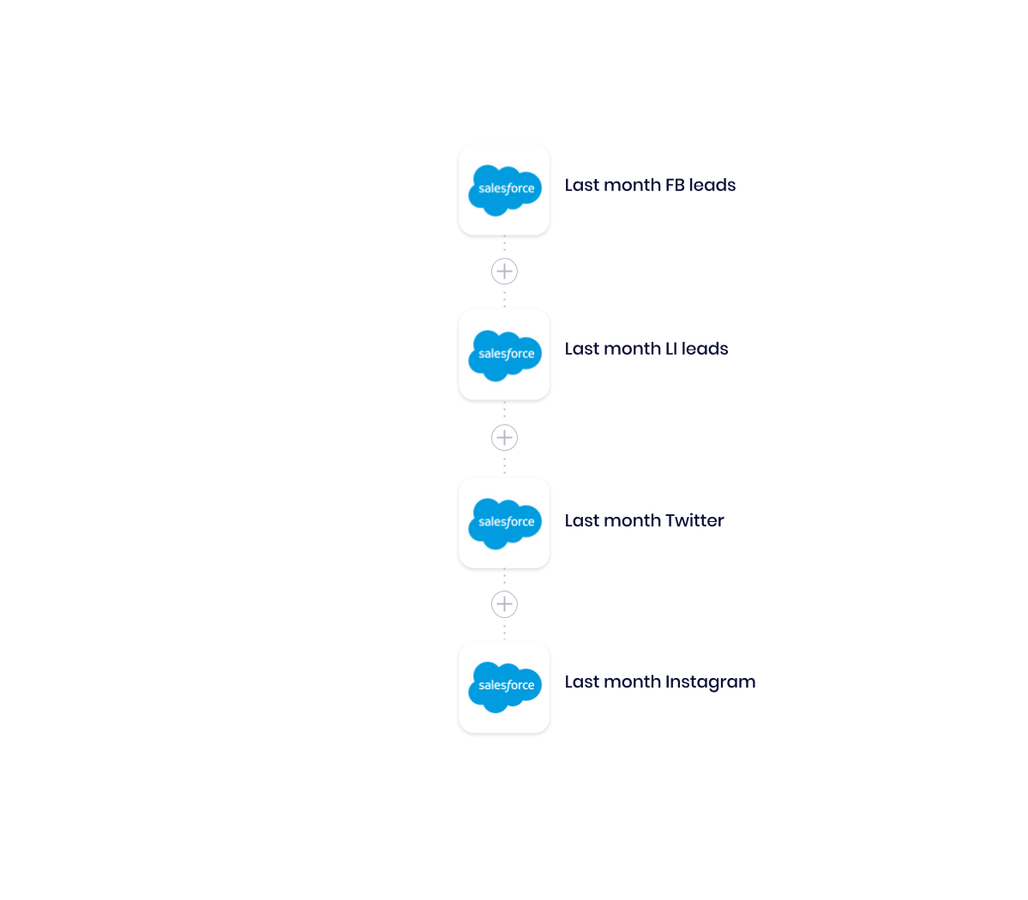
Pictured: Salesforce data calls for the previous period
The next part of our automated marketing metrics workflow calls all lead data recorded in Salesforce for the specified period (in this case, from the previous month), with leads properly tagged by source channel.
Pulling marketing metrics from the previous period offers a definitive point of comparison by which to interpret more recent channel metrics. With this data, marketers can use comparative marketing analytics like percent to goal to make more informed decisions.
The connectors we used:
- Salesforce: Our workflow includes a series of Salesforce data call steps it uses to surface all leads recorded in Salesforce tagged from a specific channel, including:
- All leads in the past month sourced from Facebook
- All leads in the past month sourced from LinkedIn
- All leads in the past month sourced from Twitter
- All leads in the past month sourced from Instagram
Part 3: Pull in the current period’s channel leads from Salesforce
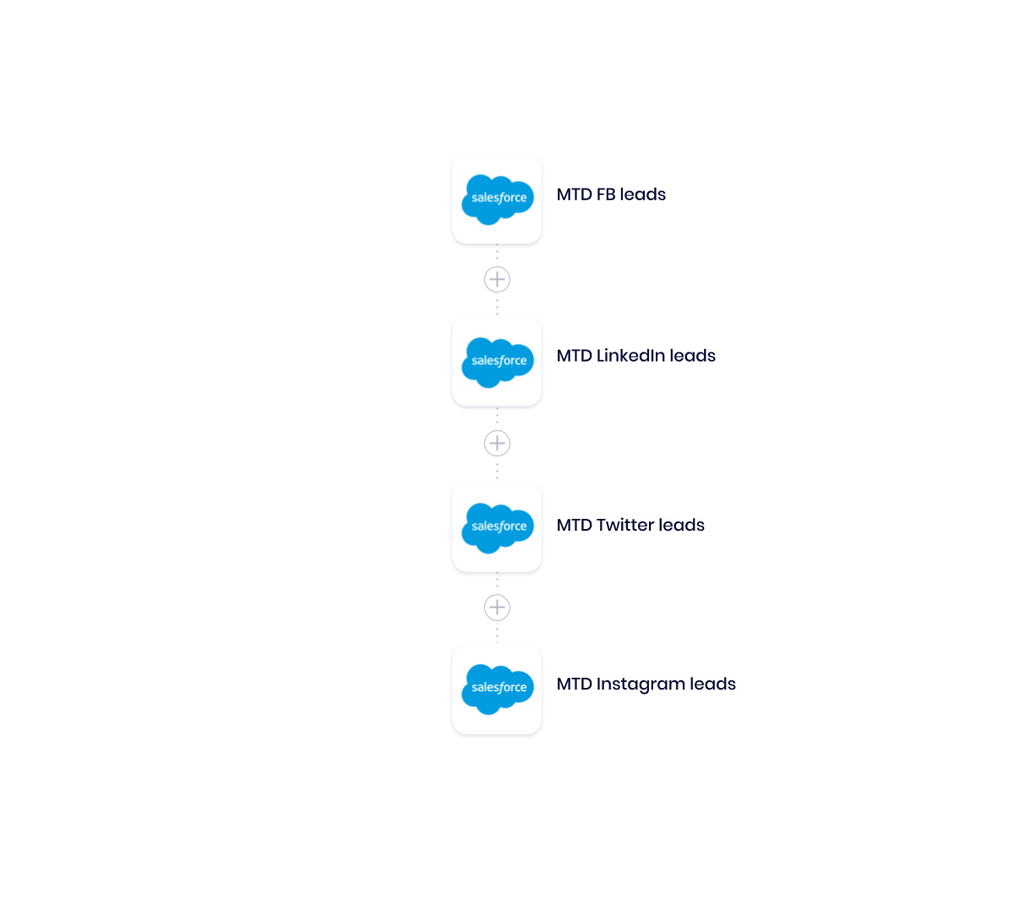
Pictured: Salesforce data calls for the current period
Much like part 2, the third part of our workflow calls all lead data recorded in Salesforce for the current period (month-to-date), again, with leads properly tagged by source channel.
The connectors we used:
- Salesforce: The workflow calls up the number of leads sourced by each channel in the current period (this month).
Part 4: Calculate relative totals and % to goal, then broadcast to Slack
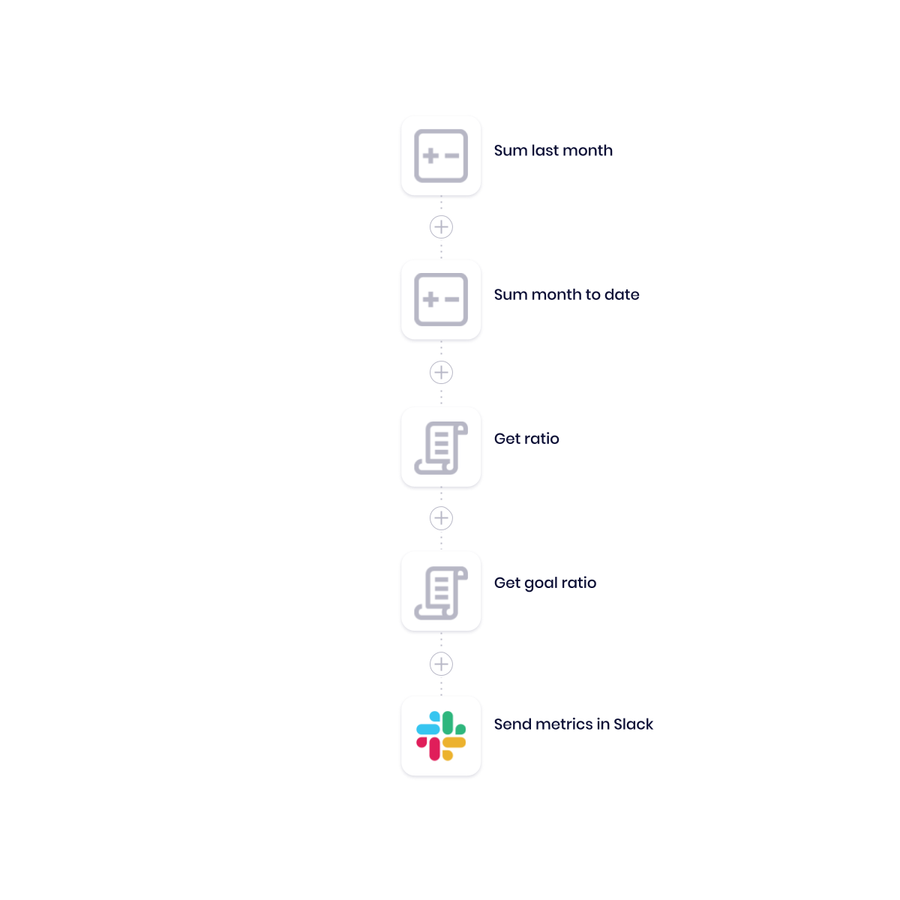
Pictured: Calculating, formatting, and sending automated marketing metrics alert
The final part of our automated marketing metrics workflow calculates and formats the data that we’ve selected to display in our alert. It first aggregates the number of leads from each channel for each period. Then, it calculates the relative percentage delta between the two periods. And finally, it calculates the current period’s percent to goal, then instantly delivers all of our chosen metrics via Slack.
The connectors we used:
- Math Helpers: These calculate the aggregate sum of leads generated by each channel for the previous month and the current month.
- Ratio calculation: Then, the workflow calculates the ratio of the current month vs. the previous month, as well as progress against the current month’s goal.
- Slack: Finally, the workflow outputs the metrics snapshot to the marketing team’s Slack channel. Which looks something like this:
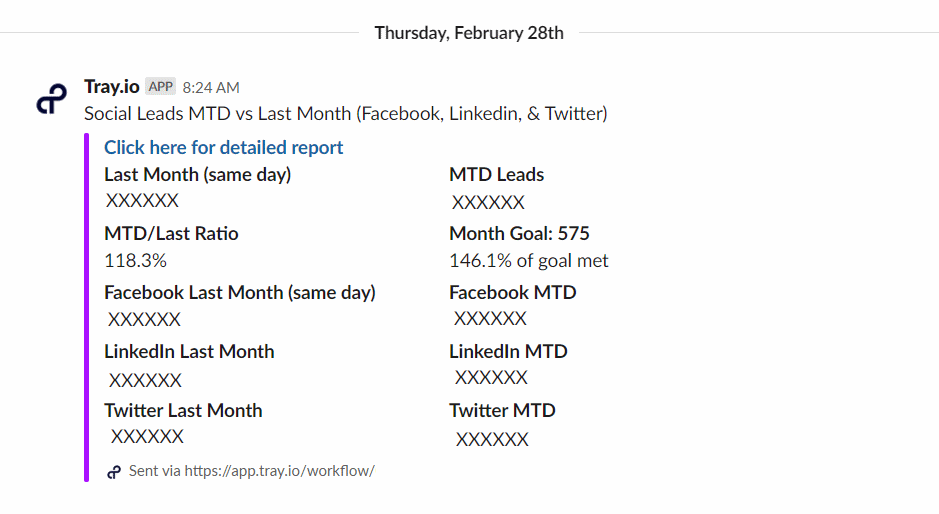
Automated marketing metrics alert in Slack
The speed and efficiency of Tray let us pull data from multiple sources, calculate additional metrics based on that data, and field it through formatting logic near-instantly.
Benefits of automating marketing metrics
While a report like this can be useful as an ad-hoc snapshot, you can probably see the ongoing value of regular Slack dashboards delivered for a variety of metrics, such as performance of additional channels including organic or paid search, or for other cross-team metrics like sales teams meeting their quotas, or for metrics from a variety of different departments.
These types of alerts can also be useful as diagnostic reality checks on newly-launched campaigns. A metrics report that shows a new campaign isn’t delivering expected baseline performance after launch could be an early warning system of a technical or logistical problem that the marketing team needs to address.
Rather than logging into and hunting around individual marketing metrics dashboards for campaign performance, or even digging into your CRM for leads recorded from specific sources, smart marketers use automation to instantly and regularly pipe campaign performance reports directly to their teams.
Discover more ways to automate your marketing processes by watching and requesting a demo.


