AWS CloudWatch
AWS CloudWatch is a monitoring service that enables users to create, update, list, and delete metric alarms to track activity on AWS resources.
Overview
The AWS CloudWatch connector enables people to create, update, list, and delete metric alarms. CloudWatch alarms track activity on AWS resources and can automatically take actions when particular conditions are met.
Notes on testing CloudWatch
Metrics
To see what metrics you can create an alarm with, try creating an alarm inside the AWS console. In CloudWatch, click 'Alarms' in the sidebar, and then 'Create alarm':
 In the next screen, click 'Select metric':
 You can then choose a metric based on its name, namespace, and the auto-scaling group OR instance it pertains to. After selecting a metric, you are also able to select actions the alarm should take. What actions you are able to take depend on the metric you are using.
Alarm actions
You can set alarms to take particular actions when a criterion is met. However, not all actions are available to all alarms: the EC2 actions are specifically for use with EC2 instances only. Click here to learn about EC2 instances.
Similarly, you can add auto-scaling actions if your metric is tracking an auto-scaling group, a feature which is also only available for EC2 instances.
Creating dummy alarms using the CloudWatch connector
If you want to create a test alarm using the connector, but are unsure of what inputs to provide, creating an alarm inside the CloudWatch console will give you a better idea, as you will have access to the names and namespaces of each metric available to you, as well as all possible actions that can be taken. You can take these inputs and plug them into connector to test that it works. For instructions on how to create or update a metric alarm using our connector, see below.
Authentication
Credentials
You will need an access/secret key in order to use the CloudWatch connector. In the AWS Console, click on your account name in the top-right corner, and click 'My Security Credentials'.
If you are using root credentials, the below page is what you will see. click 'Access keys (access key ID and secret key)' and then 'Create new access key':
 If you are using an IAM account, this is the page you will see. Under 'Access keys for CLI, SDK, & API access', click 'Create access key':
 In the window that appears, click
 Download key file (or Download .csv file for IAM users) to retrieve your AWS secret key - you can't download it again at a later date (although you can create more access/secret key pairs).
Permissions
If you are an IAM user wanting to create or update an alarm that monitors an EC2 instance, you may need some or all of the following permissions:
| Permission | Required |
|---|---|
iam:CreateServiceLinkedRole | For alarms with EC2 actions |
ec2:DescribeInstanceStatus | For alarms that use EC2 instance status metrics |
ec2:DescribeInstances | For alarms that use EC2 instance status metrics |
ec2:StopInstances | For alarms with stop actions |
ec2:TerminateInstances | For alarms with terminate actions |
Authenticating the connector
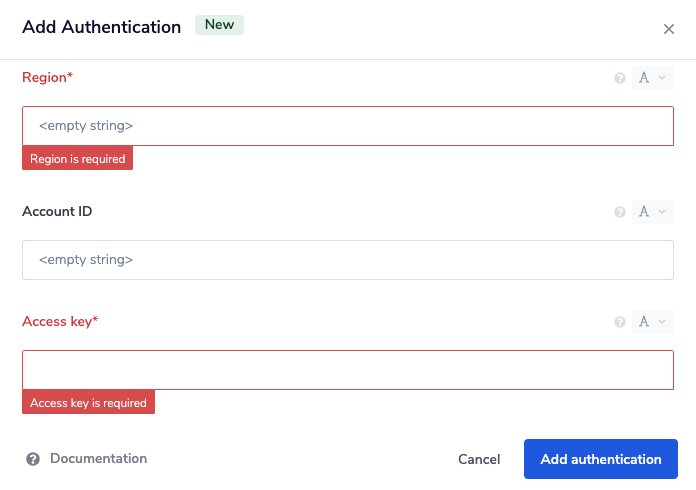
When using the Tray CloudWatch connector you must first create an authentication for a correctly configured user by clicking on 'New Authentication':
 Then entering the 'Region', 'Access Key' and 'Secret Key' for the user. Also provide an 'Account ID' if you plan to assign SNS or Autoscaling actions to an alarm:
Available Operations
The examples below show one or two of the available connector operations in use. Please see the Full Operations Reference at the end of this page for details on all available operations for this connector.
Create or update metric alarm
This operation will create a new alarm if the specified alarm name does not correspond to an existing alarm; if there already is an alarm by that name, then it will be updated.
Defining metrics:
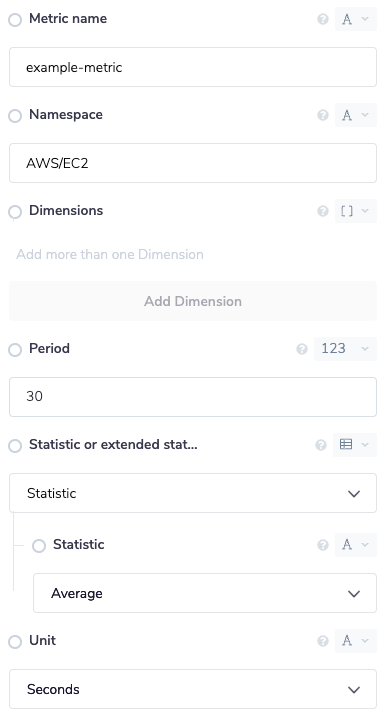
Metrics can be defined in two ways. One is to use the individual fields:
- Metric name (required)
- Namespace (required)
- Statistic or extended statistic (required)
- Period (required)
- Dimensions
- Unit
For example:
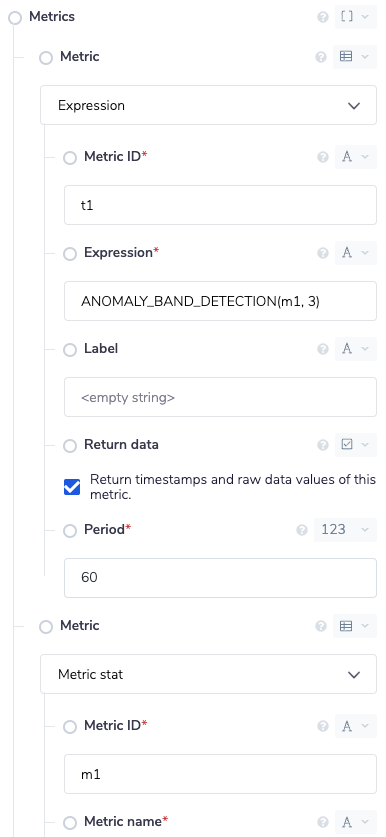
 Alternatively, you can use the metrics array to specify multiple metrics. You cannot use the individual fields at the same time. Inside the array, you can both define metrics similar to what was described above, and more simple metrics that just take a string of a mathematical expression:
Thresholds
The threshold is the value which the metric is compared against. There are two (mutually exclusive) ways to define thresholds.
First, you can define a simple threshold - this is simply a number. You will also need to specify a comparison operator, depending on whether you are checking that the alarm is greater or lower than the threshold:
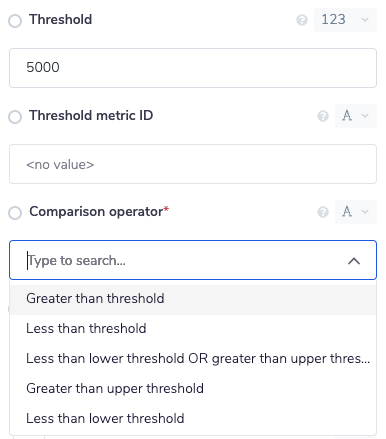 Note that, for simple thresholds, you cannot define a range of threshold values - in other words, you cannot define a separate upper and lower threshold this way. For that reason, the only two comparison operators that work are
 Greater than threshold and Lower than threshold.
Defining a threshold metric, on the other hand, DOES allow you to specify a range of values. You can define a threshold metric in the Metrics array, and repeat the metric ID you specified in the 'threshold metric ID' field:
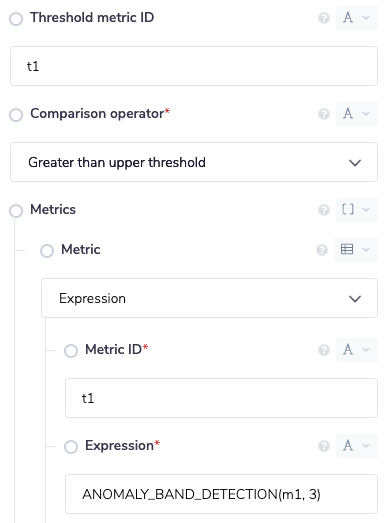 If this alarm is based on an anomaly detection model, create an Expression-type metric that uses the expression
 ANOMALY_DETECTION_BAND, like the example given above (m1 is the ID of another metric that was defined in the array).