Observability and Monitoring
Monitor MCP tool executions, audit user activity, and track performance using workflow execution logs and the Monitor tab.
Agent Gateway provides two complementary views for monitoring tool activity: execution logs for step-level detail on individual workflow runs, and insights for a high-level performance dashboard across all MCP tool executions.
Execution logs
Execution logs are available within each workflow in your Tray workspace. This is existing Tray functionality — the addition for MCP is context-specific indicators and user identity information on each execution.
Accessing execution logs
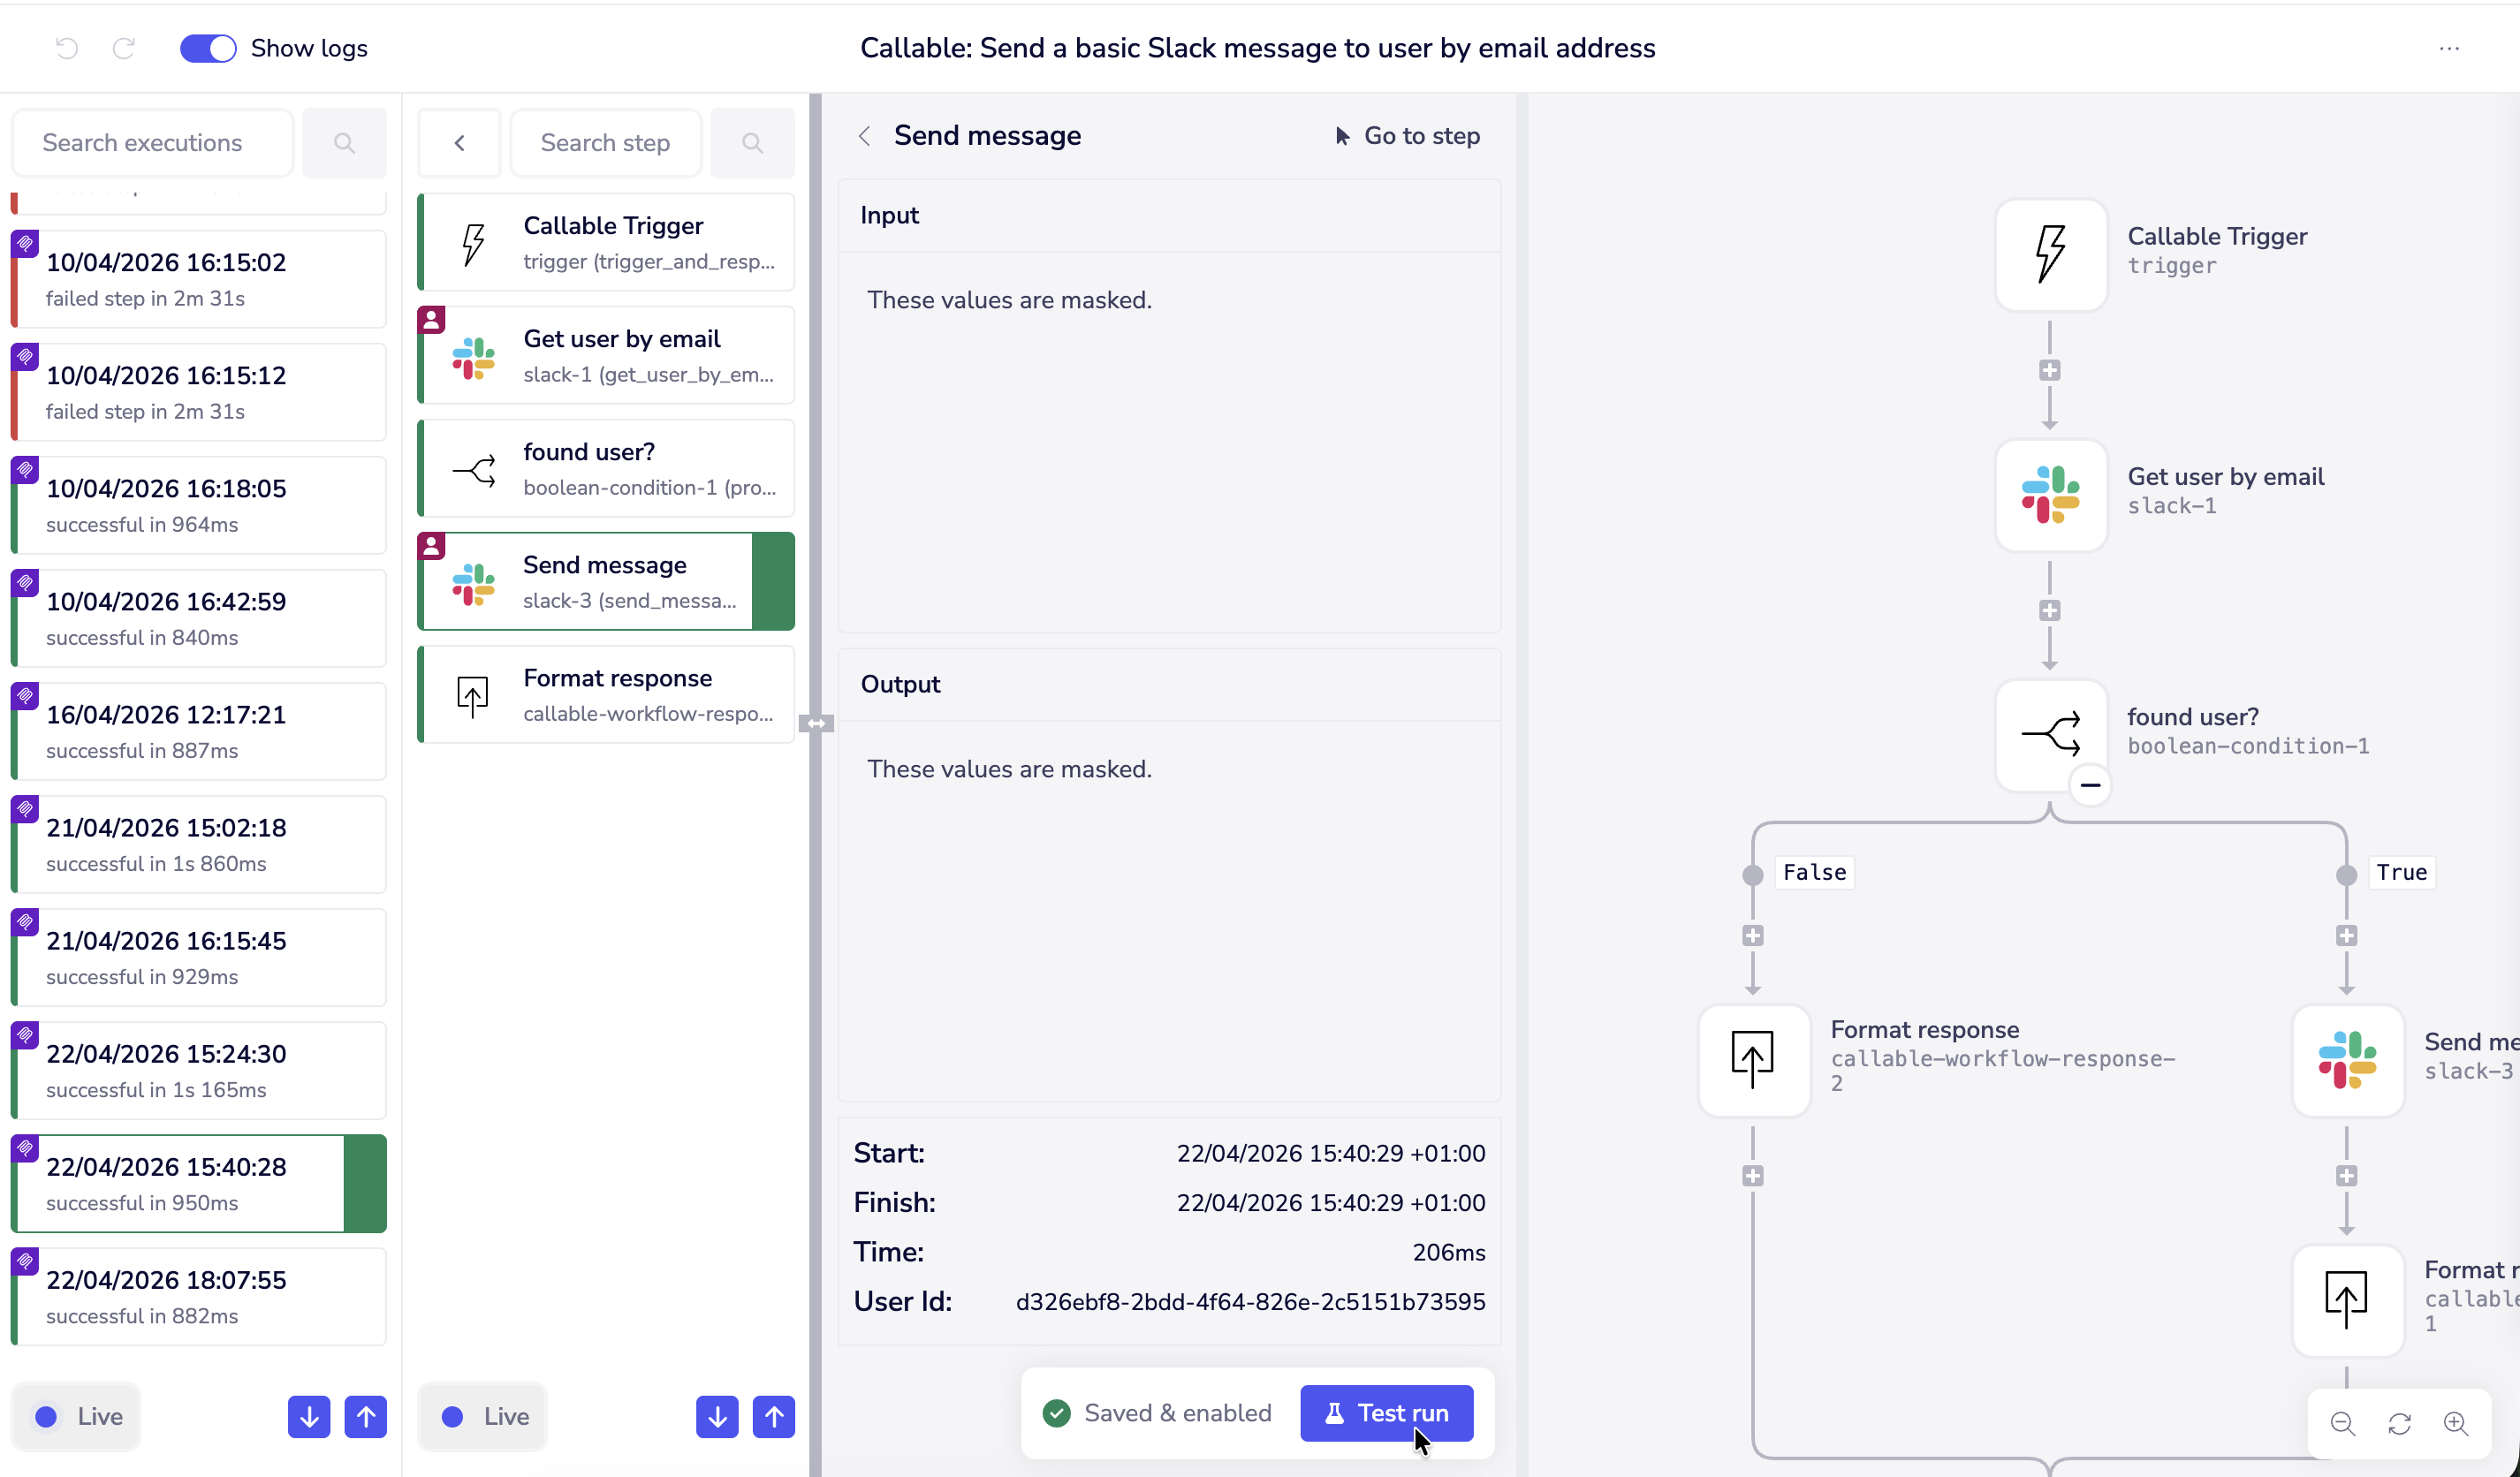
Navigate to any workflow exposed as a Workflow Tool, open the execution logs panel, and use the Show logs toggle to view step-level detail.
MCP execution indicators
Each execution tile in the left column displays a purple MCP icon if that execution was triggered in an MCP context. Executions without this icon were triggered outside of MCP — for example, a callable invoked by a scheduled workflow rather than an MCP tool call.
Within a specific execution, individual steps in the middle column are marked with an icon if that step used user-provided authentication. Hovering over the icon shows a tooltip confirming the auth context for that step.
User identity
For executions triggered via MCP, the executing user's ID is shown within the execution detail. This allows workspace builders and admins to identify exactly who triggered each run.
Log visibility and data masking
Execution logs apply the following access controls:
- Your own executions — full input and output data visible
- Other users' executions — execution is visible in the list (timestamp, status, duration) but input and output data is masked
- Workspace admins and org owners/admins — can unmask other users' execution data
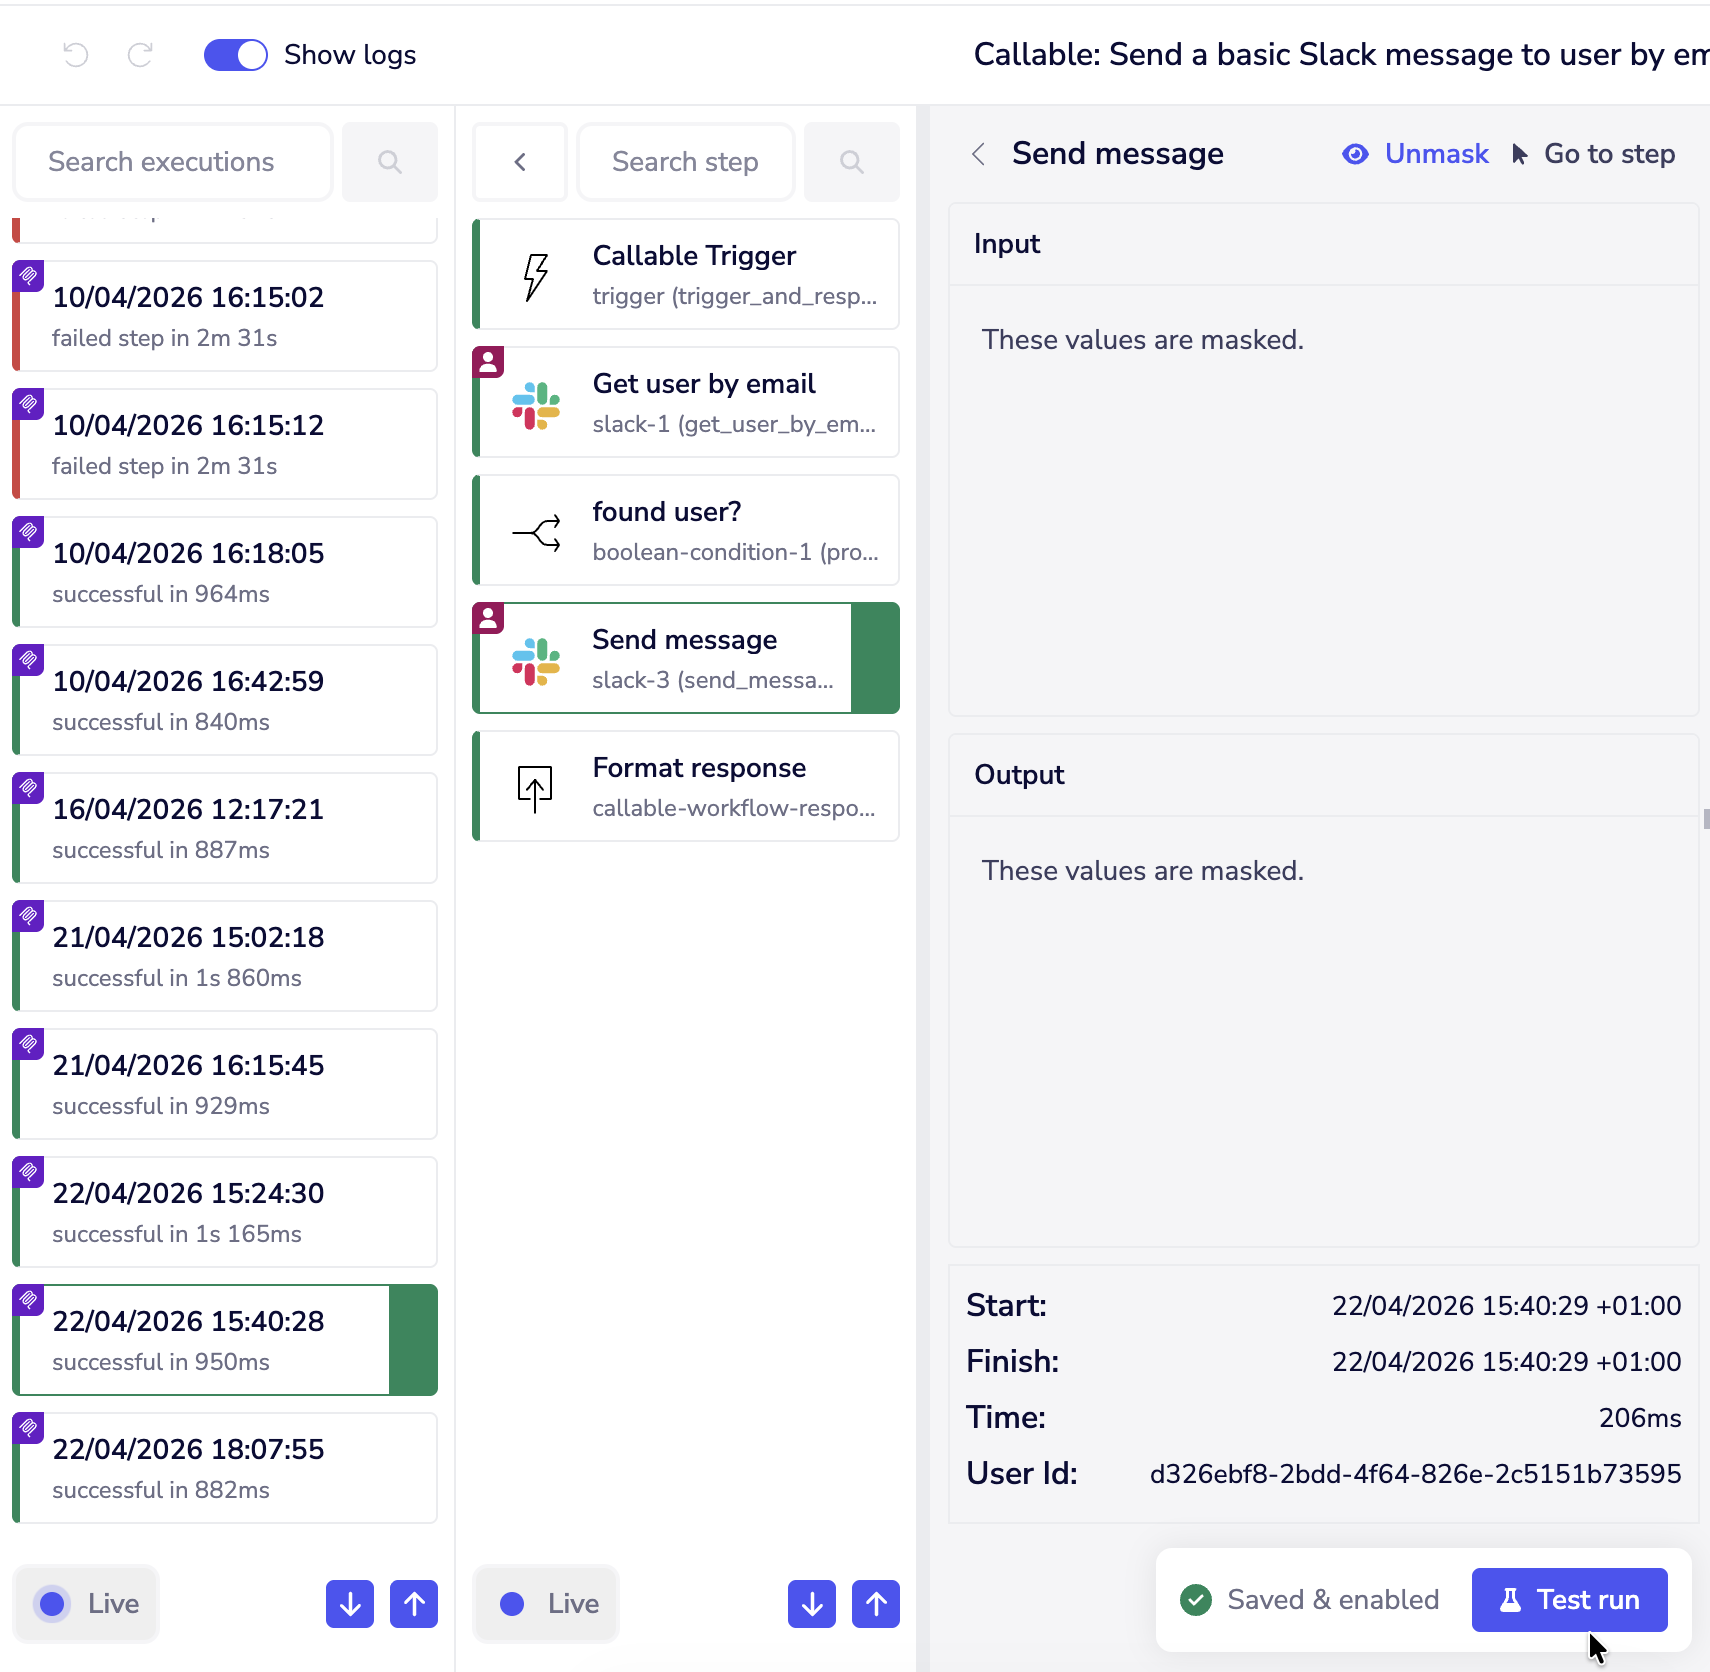
Unmasking another user's execution data is an admin action that is recorded as an audit event. Even admins with access to unmask data are subject to this audit logging, giving your organisation full visibility of who accessed what data and when.
Log streaming
All execution log data — including MCP-specific information such as which executions were MCP-triggered, which user executed them, and which steps used user-provided authentication — is available via Tray's log streaming product. Log streaming is available on certain plans and must be configured separately. See Log Streaming for details.
Detailed execution logs for connector tools are not currently available. This is planned for a future release.
Insights
The Monitor tab in your MCP Server settings provides a high-level dashboard of all MCP tool executions within a selected time period.
Accessing Insights
Navigate to Workspace Settings → Agent Gateway → MCP Server → Monitor.
Time frame
Use the time frame selector to filter the dashboard by period. Available options are 24 hours, 7 days, and 30 days as standard. Extended time frames are available on certain plans, consistent with Tray's platform-wide Insights capabilities. See Insights for plan details.
Summary metrics
The top of the dashboard shows three summary figures for the selected period:
- Task runs — total number of MCP tool executions
- Active Workflow Tool users — number of distinct users who executed workflow tools
- Active Connector Tool users — number of distinct users who executed connector tools
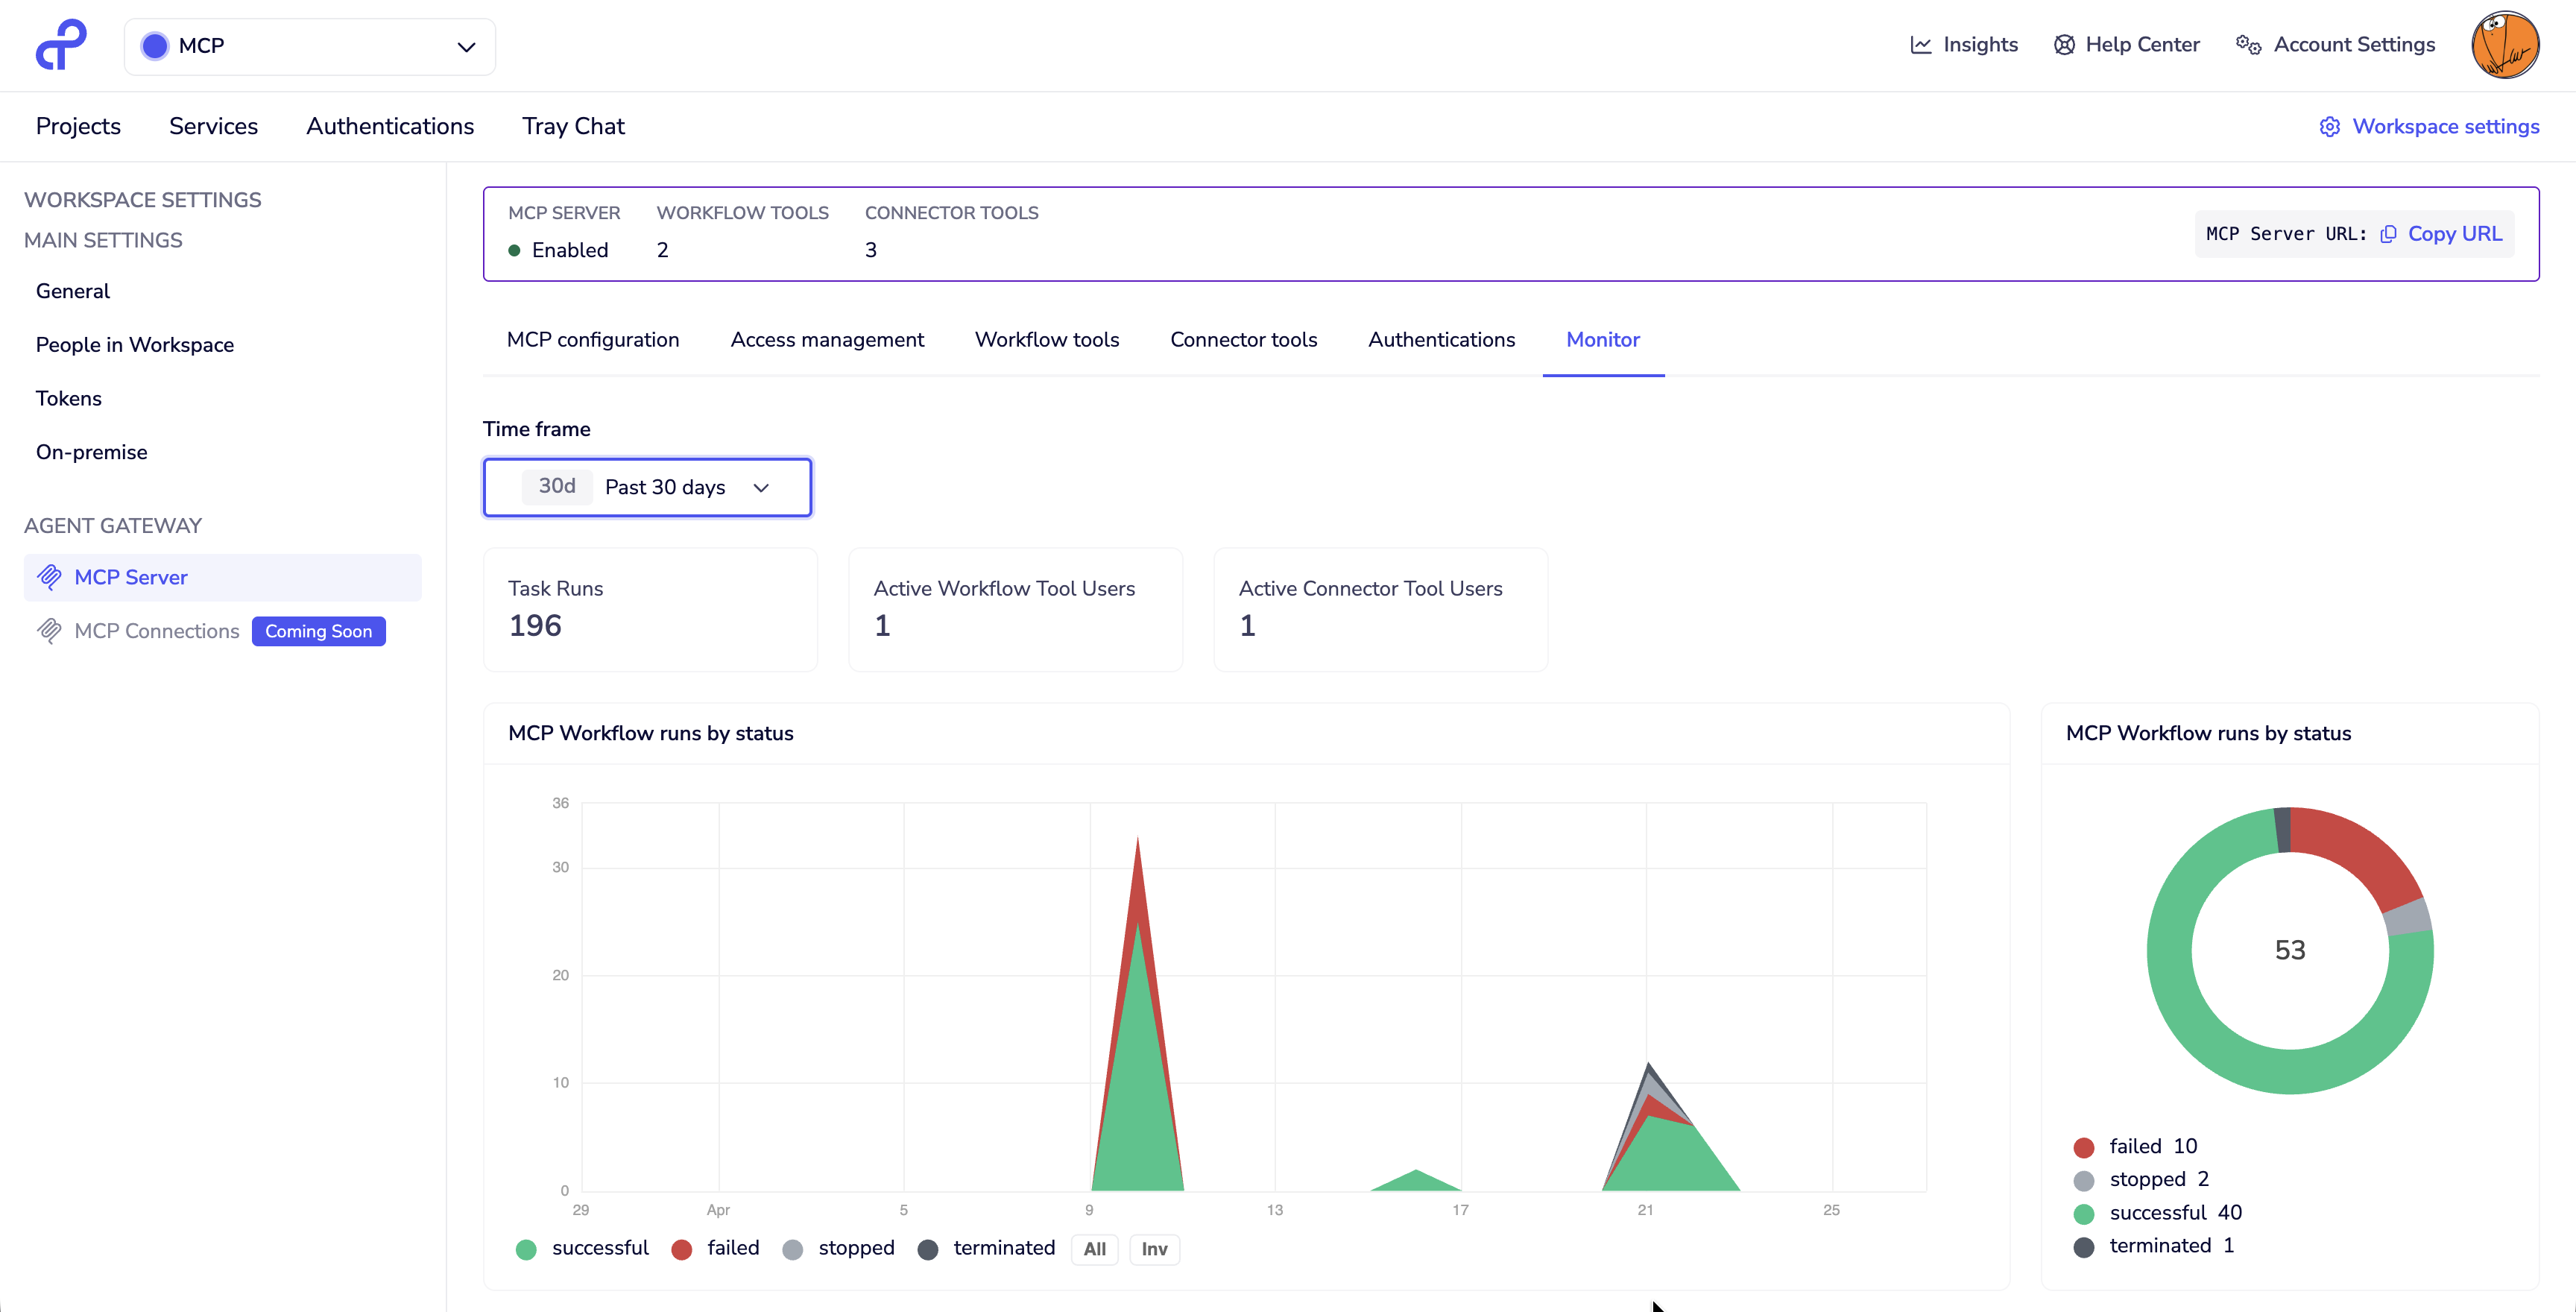
Workflow runs
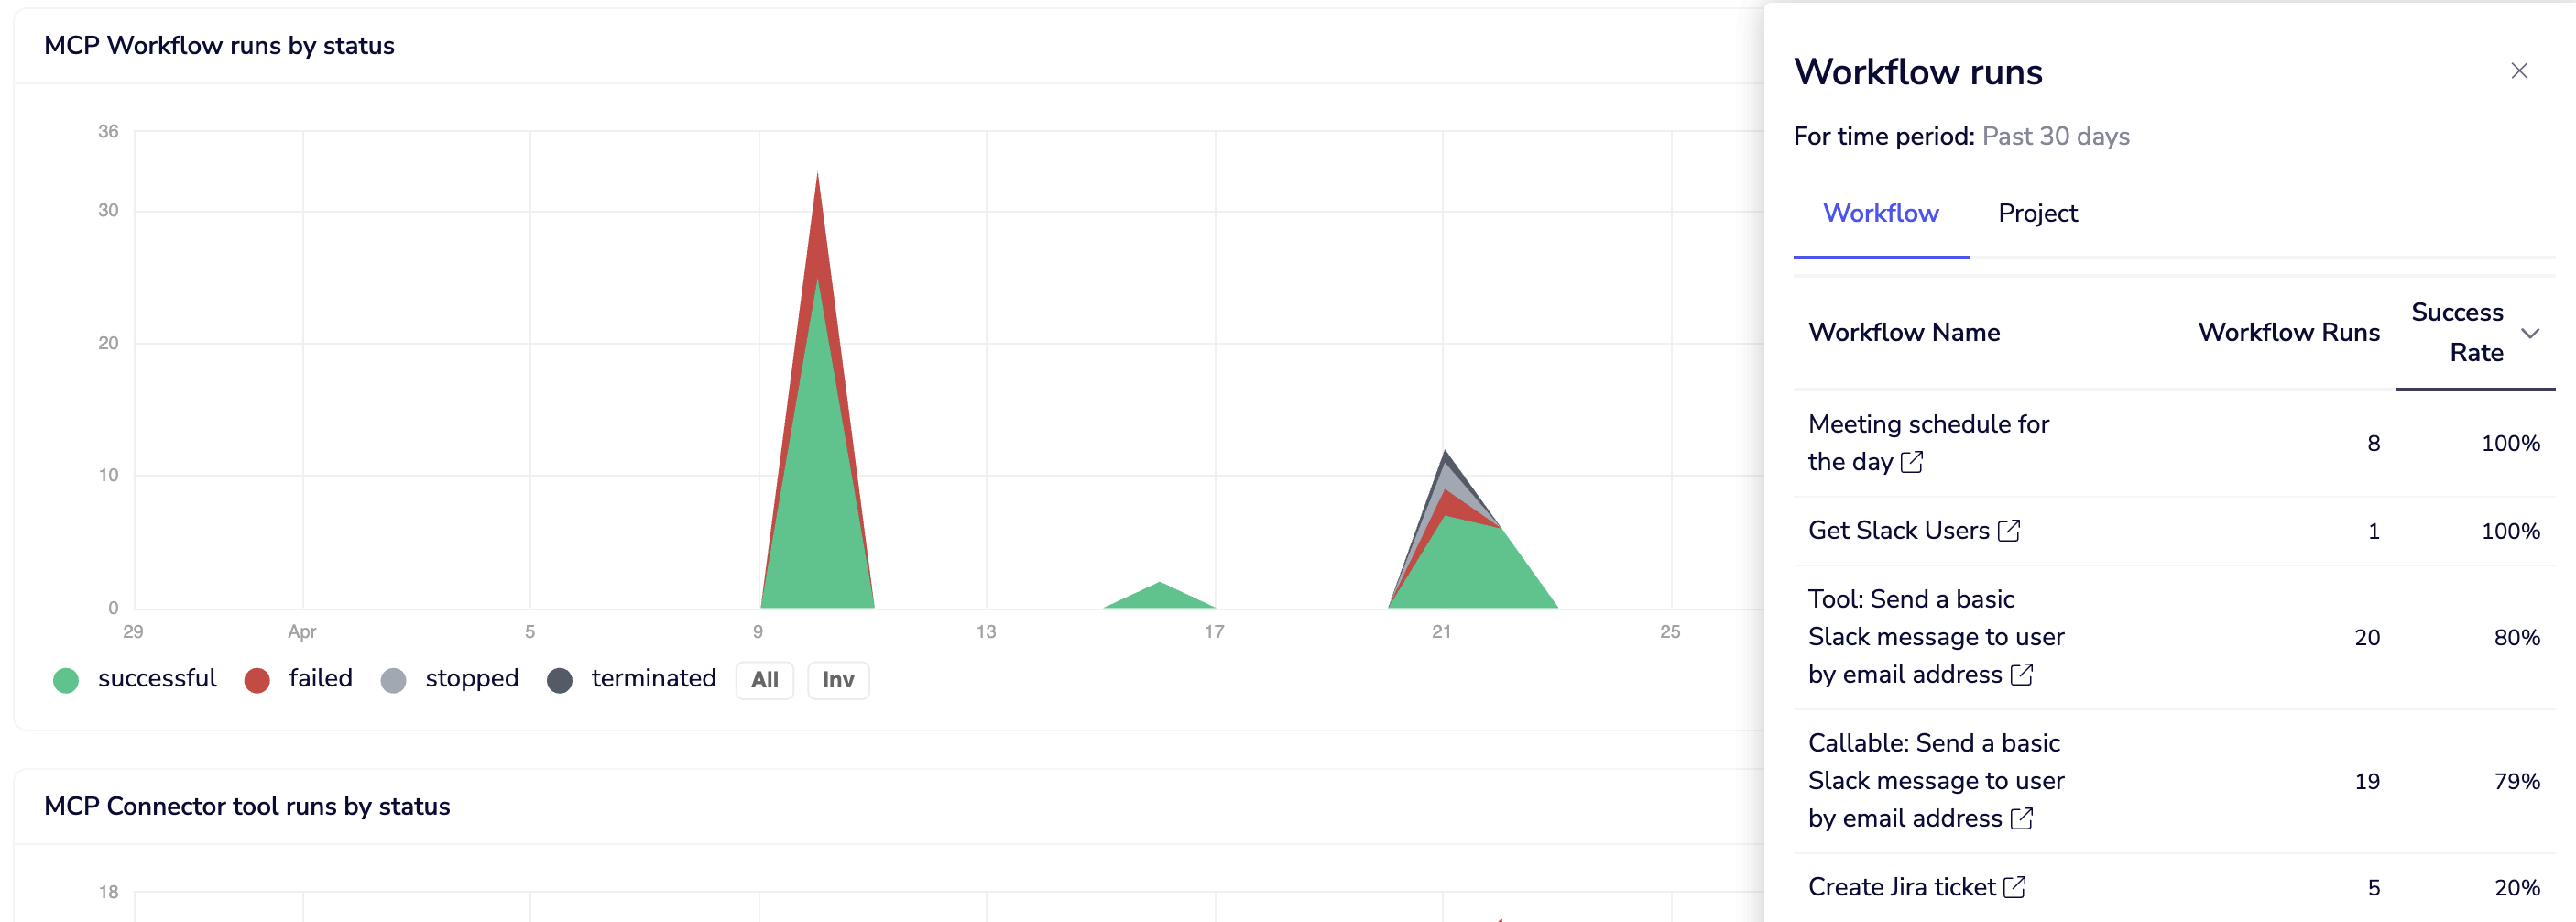
The workflow runs section shows execution volume over time, with executions broken down by status — successful, failed, stopped, and terminated. A donut chart on the right summarises the total count for the period.
You can filter the chart by successful, all, or invalid executions using the toggles below the chart.
Clicking on any point in the chart opens a detail panel showing a list of workflows with their run count and success rate for that time period, with links to navigate directly to each workflow.
Callable workflows are currently counted as separate executions in Insights. If a workflow tool calls a callable, that counts as two executions in the dashboard totals. See Troubleshooting and Limitations for details.
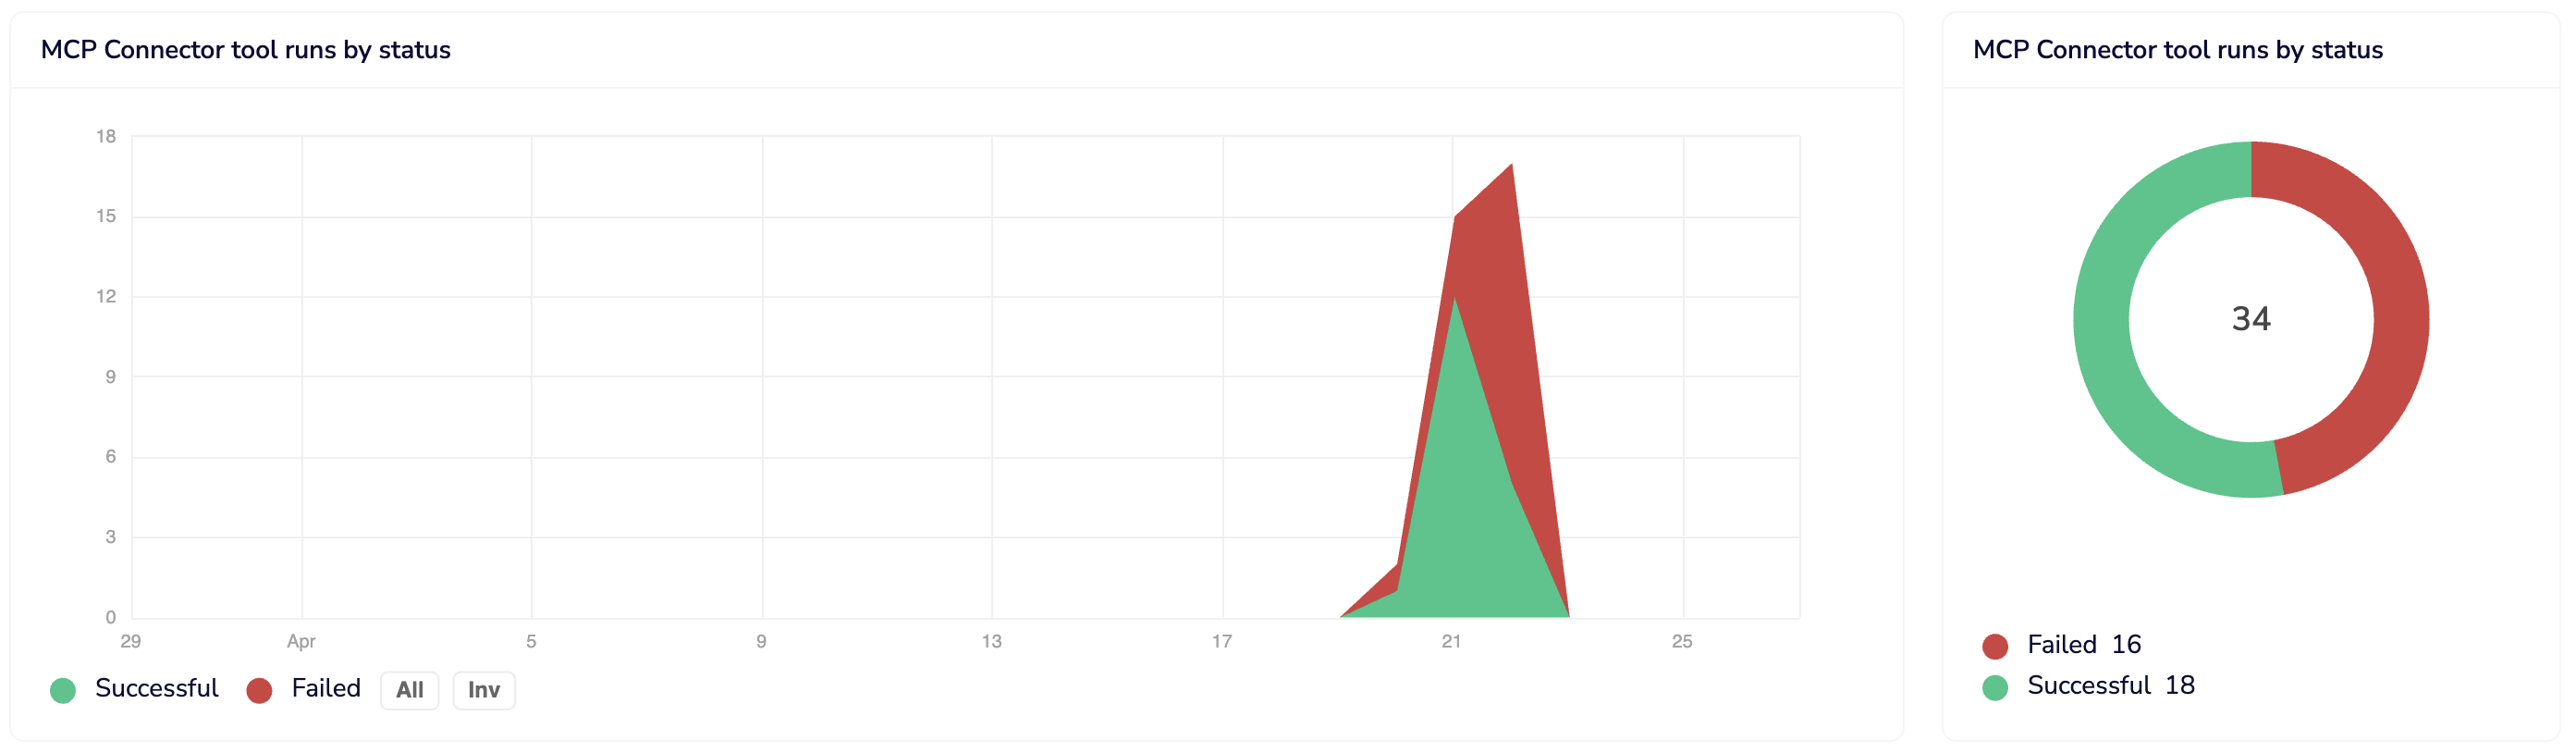
Connector tool runs
The connector tool runs section follows the same layout as workflow runs — a time-series chart, donut summary, and status breakdown. Clicking into the chart shows the connector tool name, operation, run count, and success rate.
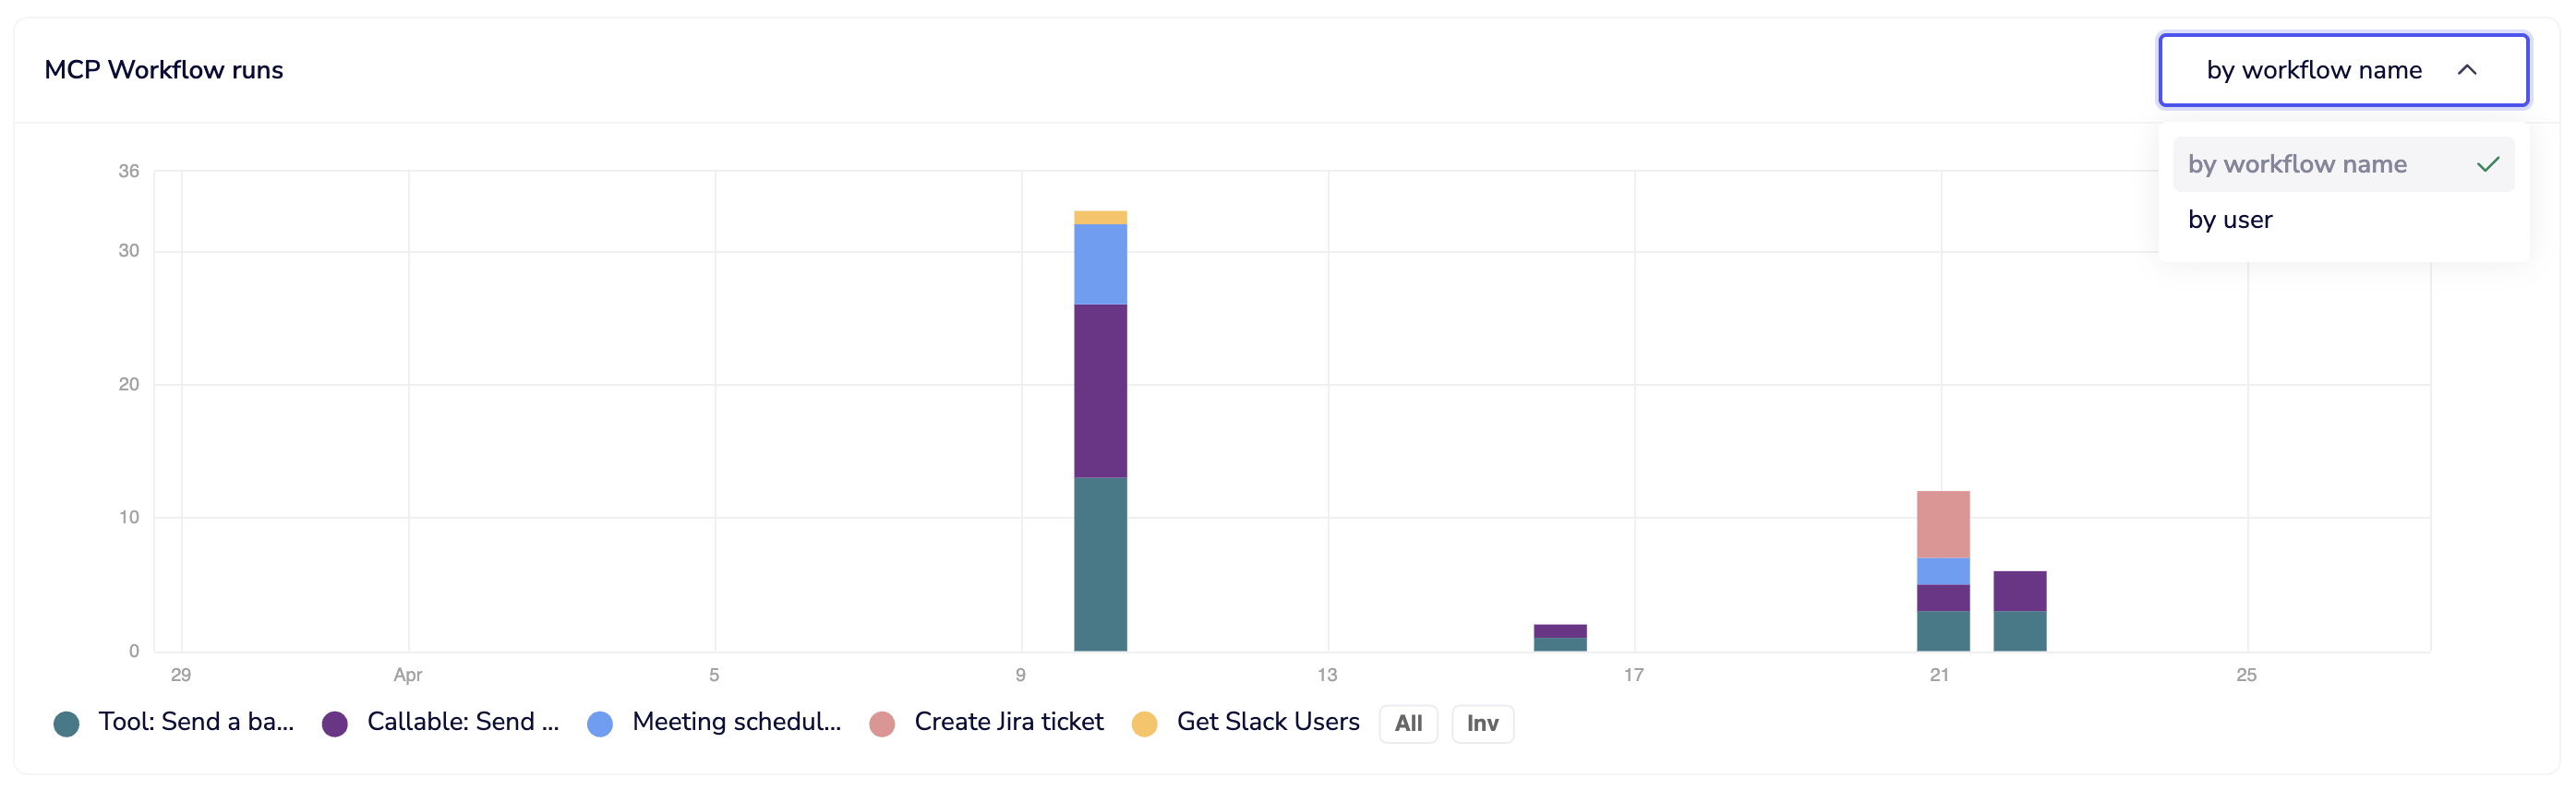
MCP workflow runs breakdown
Shows execution volume broken down by workflow tool or by user, allowing you to identify the most frequently executed tools and which users are most active within the MCP context.
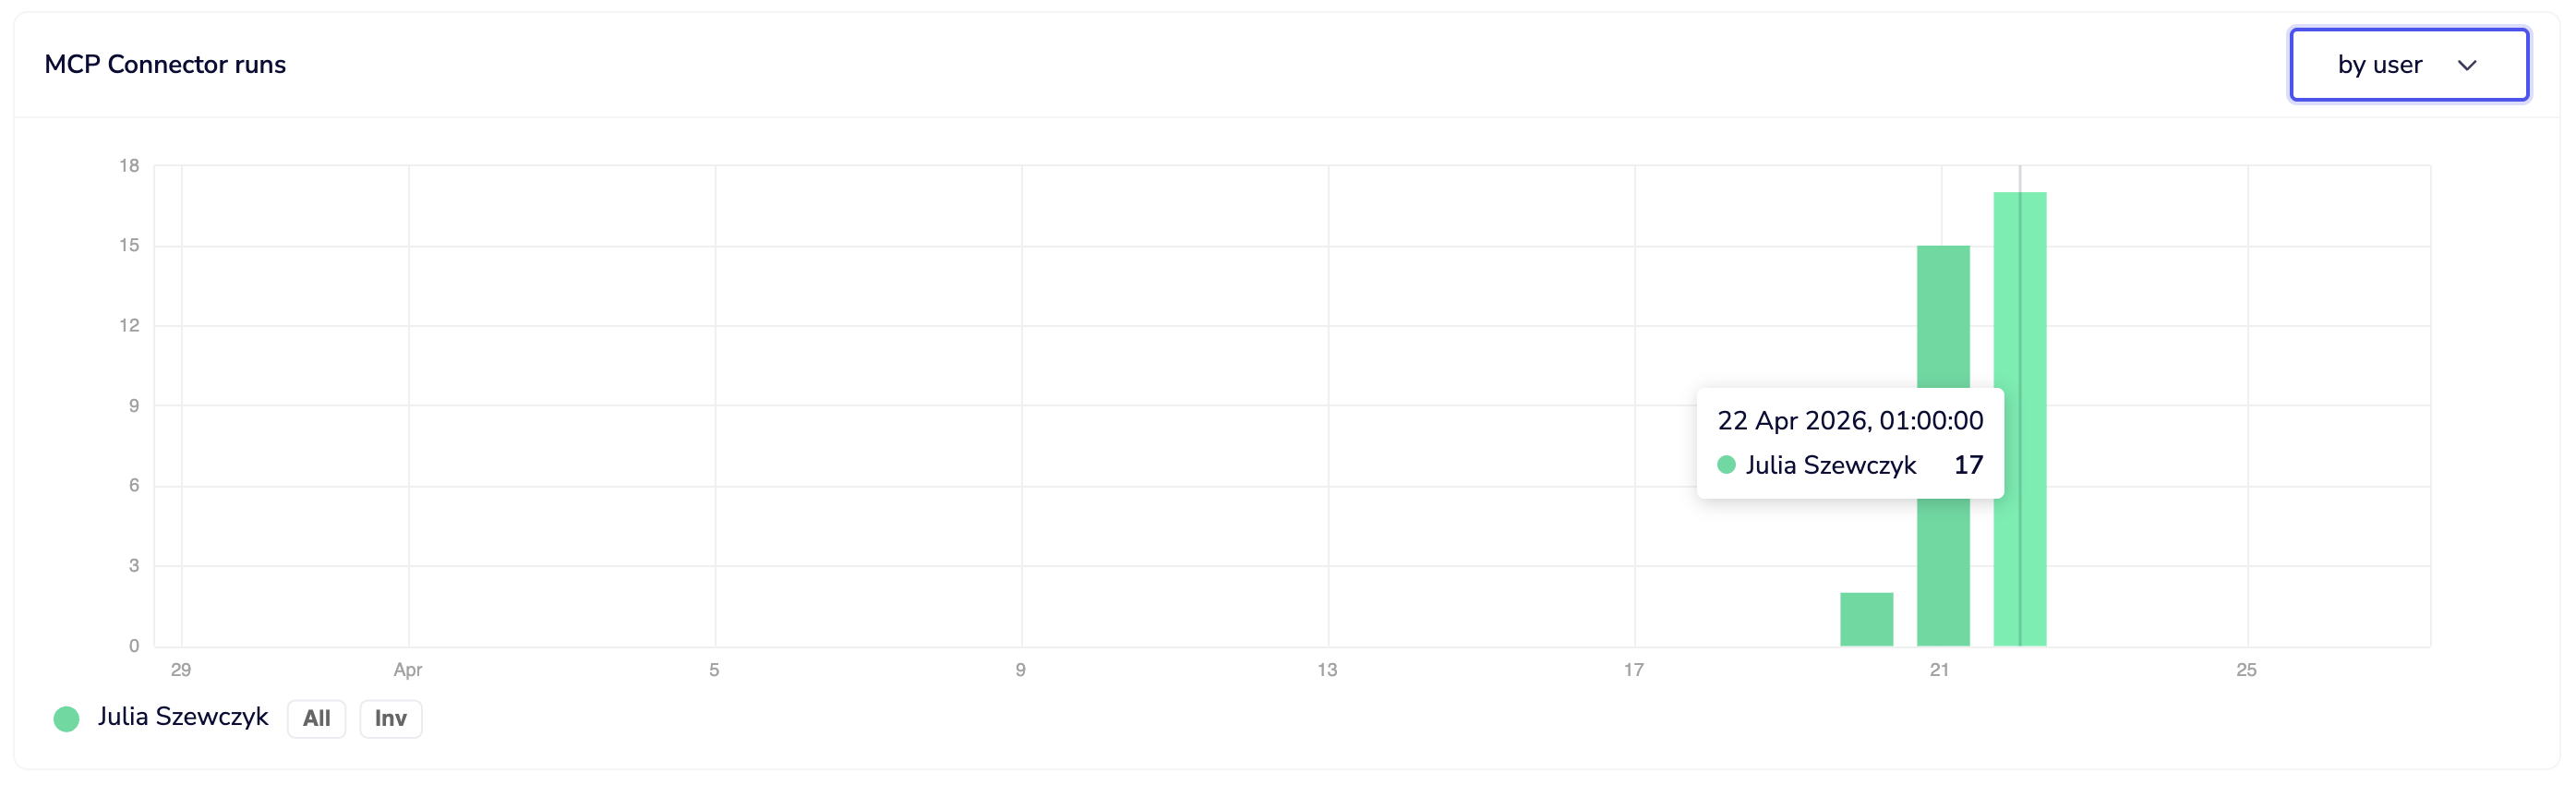
MCP connector tool runs breakdown
Shows the same breakdown for connector tools — by connector tool or by user.
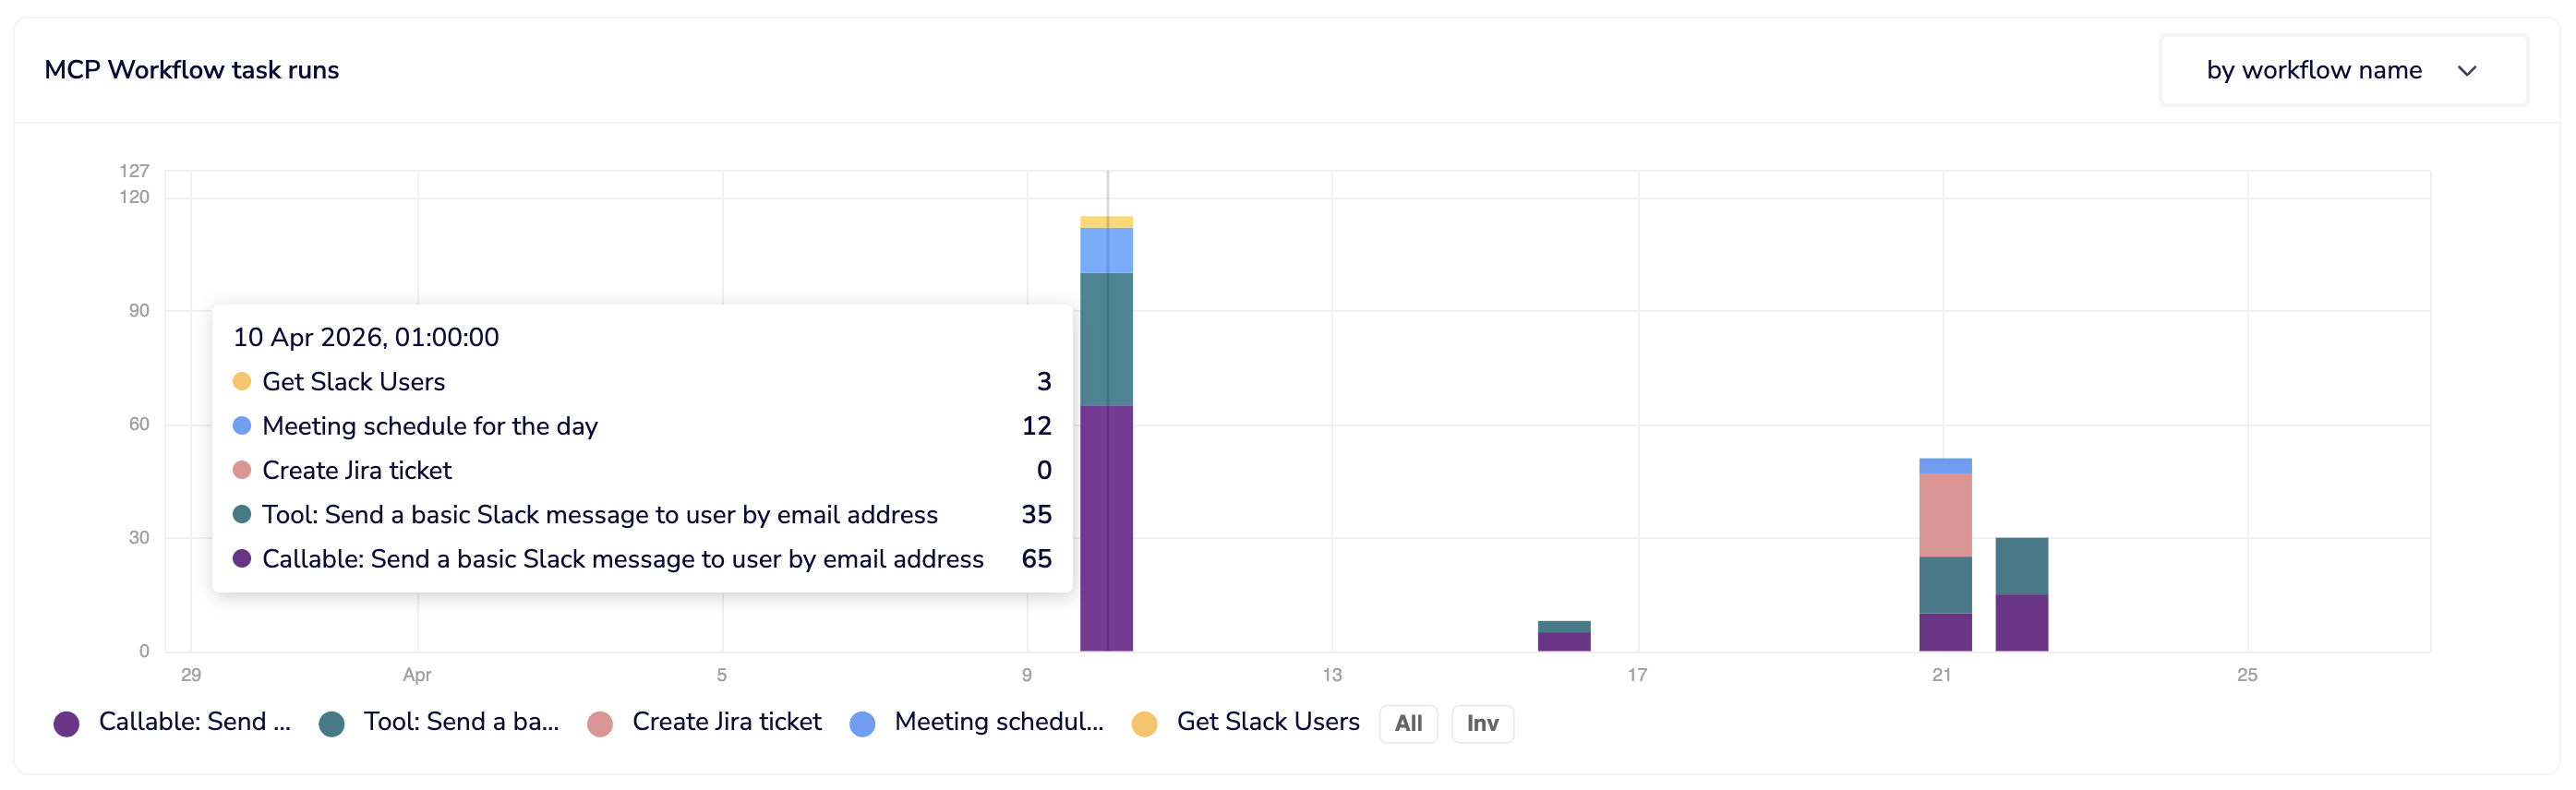
MCP workflow task runs
Workflow tools can consist of multiple steps and callables, each consuming tasks. This graph shows task consumption broken down by workflow tool or by user, giving visibility into which tools are affecting your billing the most.
MCP connector tool task runs
Each connector tool execution is a single task. This graph shows task consumption broken down by connector tool or by user.
Next steps
- Troubleshooting and Limitations — known issues and how to resolve them
- Authentication and Access — manage user access and authentication types
- User-provided Authentication — configure per-user OAuth on tools