










.DkNUKaKx_ZLAT4m.webp?dpl=dpl_Au634qxtCnaGHwTSpukv8FwHxmQD)









If you build in n8n, you already know what it does well. You can get a working automation in front of people in an afternoon, and the builder experience holds up while you’re building.
What changes is volume. The failures that appear once a workflow carries a production load are different from the ones you debug while building, and most of them never raise an error. You find them later, usually because a number somewhere downstream is wrong.
The clearest example is at the merge node.
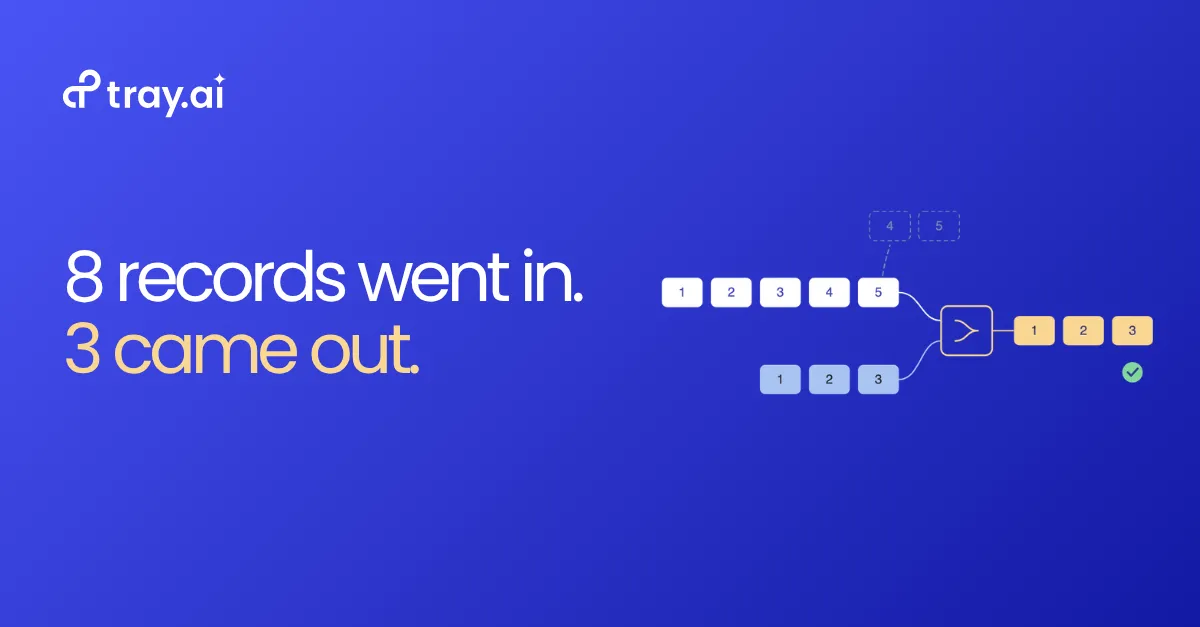
Two branches converge. One carries five items, the other carries three. The merge combines them by position: item one with item one, two with two, three with three. Then the shorter branch runs out and the merge stops. Items four and five are dropped. No error, and the run reports success.
You can reproduce it in about two minutes. Five items and three items in, three items out, green check.
You won’t catch this while building. Your test data is small and even, both branches carry the same count, and the merge does exactly what you expect. In production the counts diverge constantly, because a filter drops a record, an API returns fewer results than it did yesterday, or a lookup misses. Every time that happens, the extra items are dropped.
There is a setting for it. Combine by position has an option called Include Any Unpaired Items, which keeps the leftovers instead of discarding them. It is off by default, so the silent drop is what you get unless you already knew to go looking for it.
That is the pattern worth noticing. The behavior is documented and combining by position is the right choice for plenty of jobs. What catches people is that the default fails quietly. Nothing in the execution list flags it, so you find out when someone downstream notices a total that is wrong.
Large jobs run out of memory
n8n holds the complete output of every node in memory for the whole run. There is no streaming, so nothing is released until the execution finishes.
Where that breaks depends on your payload and how much RAM the instance has. Teams hit JavaScript heap errors on datasets in the hundreds of items once the JSON gets heavy, and n8n’s own documentation points you toward splitting work into sub-workflows so each batch frees its memory before the next one starts.
The jobs this affects are your largest ones: the quarterly reconciliation, the annual export, the backfill after an outage, the migration you run once.
You already know the workarounds: batch the data yourself, split one workflow into several, add polling loops to reassemble the results. They work. They’re also more logic to write, test, and maintain, and none of it exists to do the job you set out to do.
Execution retention becomes a setting you have to manage
n8n saves every node’s input and output for every execution. Pruning is on by default, at 14 days or 10,000 finished executions, whichever comes first.
At pilot volume those defaults are invisible. At production volume they push in both directions at once. A workflow firing once a minute passes 10,000 executions in about a week, so the history you need for debugging is already gone. Raise the limits to keep it and the executions table grows fast instead, which slows queries and lengthens backups.
Neither outcome is a failure of the tool. It is a set of numbers you now own and re-tune as volume changes. On SQLite, pruned space is not returned to disk until you run VACUUM.
Scaling past one instance means running a distributed system
A single n8n instance has a throughput ceiling. Getting past it means queue mode: Redis, multiple workers, and a load balancer in front of them.
That’s a normal architecture, and you now operate it. Someone on your team sizes the workers, tunes Redis, and gets paged when a worker dies mid-execution and nobody can tell whether the run finished.
You also don’t control when that system changes. One team had a platform update spike their Redis queue load roughly sixfold, and spent roughly six months stabilizing it.
Why none of this shows up in a pilot
You can open any single execution and read it. What’s harder to see is the pattern across thousands of them: which workflows consume the most resource, which are queuing behind others, and which are finishing with fewer records than they started with.
| In a pilot | In production | |
|---|---|---|
| Data volume | Small test sets | Whatever the source returns that day |
| Branch counts | Even, so merges pair cleanly | Diverge constantly, so items drop |
| Concurrency | One run at a time | Runs queue behind each other |
| Retention defaults | Never reached, so never noticed | Hit in days, and need re-tuning |
| What surfaces | Errors you can see | Totals that don't match |
A pilot can’t produce any of these failures. The data is small, the branches are even, concurrency is low, and the database hasn’t had time to grow. Every condition that causes the problems above is one your test environment doesn’t have.
What changes on a managed runtime
The operational load underneath the workflows moves to the platform.
Streaming and chunking
Large data is processed in pieces, so a job doesn't fail because the payload didn't fit in memory.
Scaling handled by the platform
No queue architecture for your team to size, tune, or get paged about.
Managed execution history
Retention is handled by the platform rather than being a set of limits you tune as volume changes.
Observability included
See what's running and what's struggling before someone downstream tells you.
Where to start
If you’re running n8n and volume is growing, these are worth answering honestly before the next load increase rather than after it.
- Can you prove records aren't dropped when your branches merge?
- Have you tuned the execution retention defaults to your actual volume?
- Have you load-tested well beyond current volume and had it hold?
- Is there one specific person who would size the queue workers at ten times today's volume?
Anything you can’t answer cleanly is a risk you already own, on n8n or anywhere else.
Tray.ai isn’t the only platform built for this. See the full n8n alternatives roundup or a direct comparison with n8n for how the options stack up on scale specifically.
Score your n8n setup against 25 production checks
Most n8n teams discover their gaps after a failure, not before. The production readiness checklist walks through merge node defaults, which bite at any volume, plus the memory limits, retention settings, and queue architecture that do change between a pilot and real load.
Take the readiness checklist →